


Gold and Crude Oil Showing Signs of Strength and Higher Prices
Commodities / Commodities Trading Jul 07, 2011 - 03:48 AM GMTBy: Chris_Vermeulen

 This has been an interesting year for both gold and oil. There has been wild price swings due to extreme political, economic and weather events round the globe making these commodities a little more difficult to trade than normal. That being said if we look at the charts it appears we could be at the beginning stages of another major rally in both stocks and commodities.
Let’s just jump right into the charts…
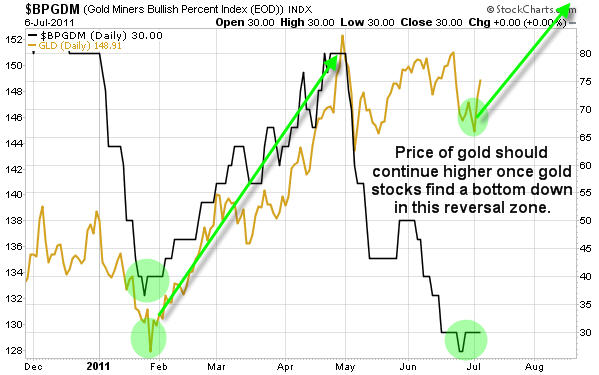
Gold Miner Stock Bullish Percent Index:
If you take a look at the bullish percent chart for gold miner stocks it appears that stocks are trading at the lower reversal zone. The last time we had a similar setup like this gold rallied 15% and gold stocks jumped nearly 25% over the following 3 months.
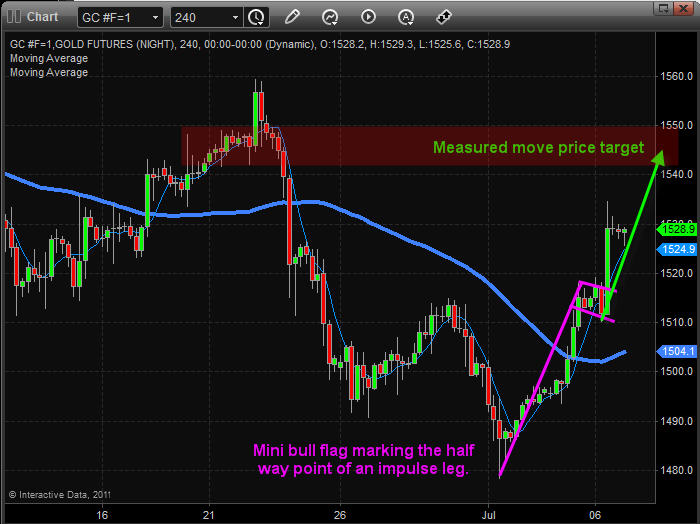
Gold Bullion 4 Hour Futures Chart:
This chart of gold shows us that a bottom formed in early July and that buyers are now in control. It looks as though we are getting the first impulse leg which should top out around $1550. After that I would expect some type of pause or pullback before price continues higher. This is also when I will be looking to enter precious metals as long as price and volume action confirm this upward thrust.
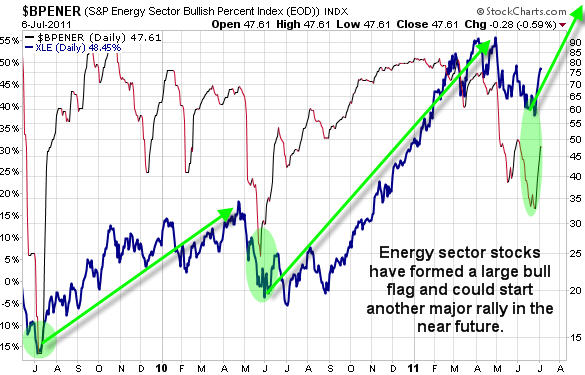
Energy Sector Bullish Percent Index:
While these bullish percent charts are not the best for entry points in the market, they do warn us of possible tops or bottoms. This allows us to adjust our protective stops, entry prices and or profit targets. This BP chart of the energy sector looks as though it’s trying to bottom. I would like to see the June high get taken out on both the BP chart and XLE etf before thinking energy is in a new uptrend.
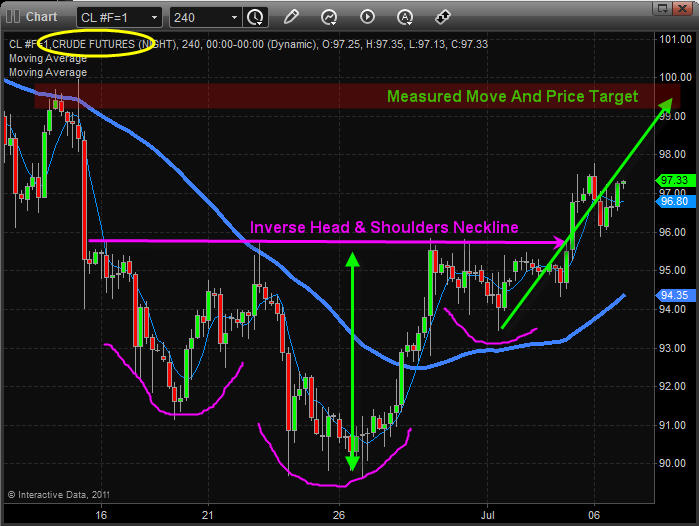
Crude Oil 4 Hour Futures Chart:
This chart shows the inverse head and shoulders pattern which formed over the past couple weeks. Simple analysis provides us with a short term bullish pattern and price target.
Mid-Week Trading Conclusion:
In short, I feel the US dollar is about to start heading lower once again and that will help boost stocks and commodities. Most stocks and commodities are trading just under key resistance levels so the next couple trading sessions are important. We need to see another push higher for these resistance levels to be taken out. If that happens then the sky is the limit for the next rally.
I would like to see the energy and financial sectors start to rally here and Also we need to see the US dollar head back down in the coming sessions.
If you would like to get more of my daily analysis to join my newsletter at www.GoldAndOilGuy.com
By Chris Vermeulen
Chris@TheGoldAndOilGuy.com
Please visit my website for more information. http://www.TheGoldAndOilGuy.com
Chris Vermeulen is Founder of the popular trading site TheGoldAndOilGuy.com. There he shares his highly successful, low-risk trading method. For 6 years Chris has been a leader in teaching others to skillfully trade in gold, oil, and silver in both bull and bear markets. Subscribers to his service depend on Chris' uniquely consistent investment opportunities that carry exceptionally low risk and high return.
This article is intended solely for information purposes. The opinions are those of the author only. Please conduct further research and consult your financial advisor before making any investment/trading decision. No responsibility can be accepted for losses that may result as a consequence of trading on the basis of this analysis.
© 2005-2022 http://www.MarketOracle.co.uk - The Market Oracle is a FREE Daily Financial Markets Analysis & Forecasting online publication.