Recovery Scenario in Jeopardy for JPM
Companies / Company Chart Analysis Jul 11, 2011 - 01:53 PM GMTBy: Mike_Paulenoff
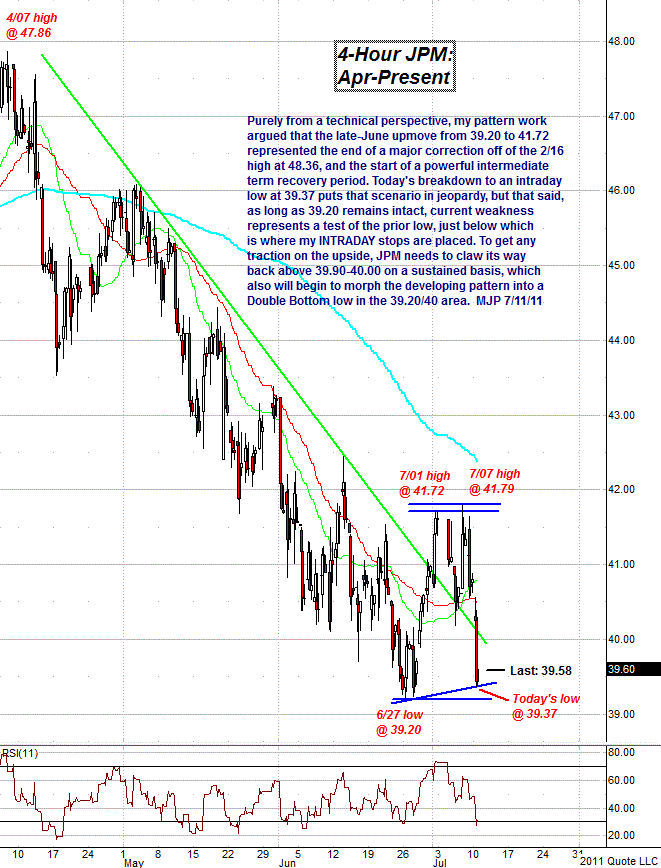
Purely from a technical perspective, my pattern work in JP Morgan (JPM) has been arguing that the late-June upmove from 39.20 to 41.72 represented the end of a major correction off of the Feb 16 high at 48.36 and the start of a powerful intermediate-term recovery period.
Today's breakdown to an intraday low at 39.37 puts that scenario in jeopardy. That said, however, as long as 39.20 remains intact, current weakness represents a test of the prior low, just below which is where my intraday stops are placed.
To get any traction on the upside, JPM needs to claw its way back above 39.90-40.00 on a sustained basis, which also will begin to morph the developing pattern into a double-bottom low in the 39.20/40 area.

Sign up for a free 15-day trial to Mike's ETF & Stock Trading Diary today.
By Mike Paulenoff
Mike Paulenoff is author of MPTrader.com (www.mptrader.com), a real-time diary of his technical analysis and trading alerts on ETFs covering metals, energy, equity indices, currencies, Treasuries, and specific industries and international regions.
© 2002-2011 MPTrader.com, an AdviceTrade publication. All rights reserved. Any publication, distribution, retransmission or reproduction of information or data contained on this Web site without written consent from MPTrader is prohibited. See our disclaimer.
Mike Paulenoff Archive |
© 2005-2022 http://www.MarketOracle.co.uk - The Market Oracle is a FREE Daily Financial Markets Analysis & Forecasting online publication.


