Agri-Foods Price Consolidation Fuel for the Next Rally
Commodities / Agricultural Commodities Jul 20, 2011 - 11:25 AM GMTBy: Ned_W_Schmidt
 Primary difference between a correction and a consolidation is the depth of the downward price movement. Consolidations are milder, though that might require a longer time period. In both though, an important regenerative process takes place. The fuel for the next rally is accumulated, and thinking is refreshed. In short, both should be welcomed, and their conclusion anticipated.

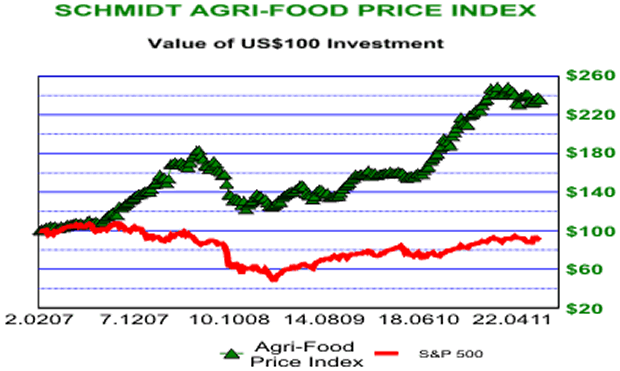
In the above chart is plotted the Agri-Food Price Index. It has been in a rolling, sector-oriented consolidation for now about 24 weeks. The depth of that consolidation has not been great, only about 5%. With all averages, sectors perform differently. Cotton has fallen 50% from the 90-week high. In contrast, rice is down a mere 1% and U.S. hog prices are only off 2%, from their respective 90-week highs.
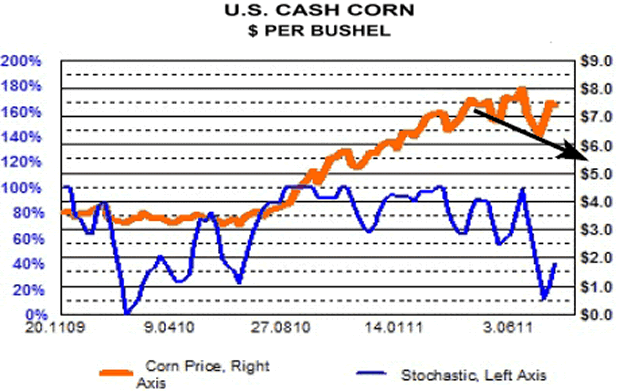
Recently achieving leadership, in terms of relative strength, has been price of corn. Such a development comes after a period of strong price performance, and usually indicates weaker price action in the near future. As portrayed in the chart below, U.S. corn prices had been working on a triple from the lows of last year.

As the calendar pages have advanced naturally, price of corn seems to have peaked. That change in trend is highlighted by the arrow and the stochastic oscillator. When such a pattern develops, as is portrayed in the chart, after a long, strong rise, it often suggests a change in the trend for the channel. Fundamentals would seem to support that view.
North American corn harvest is now only about eight weeks off, as it happens once a year about the same time. Everyone knows that. Buyers know that the new corn crop is on the horizon. All indications at the present are that it will be good harvest. Knowing what they have in the bin, buyers are not willing to aggressively bid at this time. Those holding what is about to become old crop corn know that any sales might soon have to compete with a lot of new crop corn. In short, simply not a lot of pressure for corn price to move higher at this time. We also know that ethanol production will be a demand constraint in coming year. Corn usage to make ethanol in U.S. will be essentially flat.

In looking for beneficiaries of the current situation we note hog producers. Hog prices, as mentioned above, are near 90-week highs due to a combination of rationalized production, demand growth from China, and hog disease in South Korea. While hog price refers to the revenues of the hog producers, price of corn is an important input price. Note that pork is not produced in a factory, but is the net result of feeding corn to hogs.
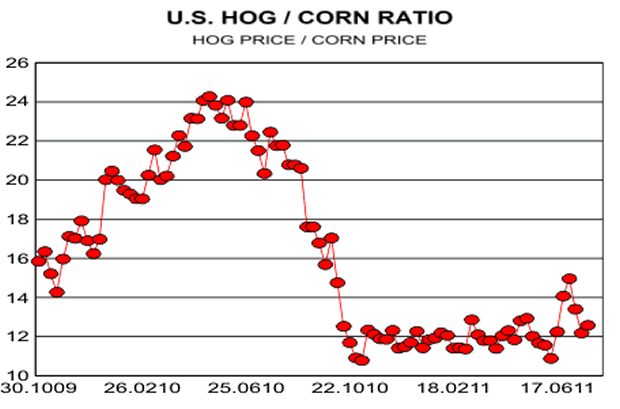
In the above chart is plotted the ratio of U.S. hog prices to U.S. corn prices, a proxy for the profitability of hog producers. That ratio collapsed in 2010 as corn prices rose. It has been stabilizing for about eight months. Recently, the ratio broke out above the range of the previous eight months. If corn prices stabilize, at least relative to hog prices, profitability of hog producers could improve dramatically.
While considering the average of that ratio over the period shown might have some issues, the average ratio does suggest some opportunities. If the ratio simply moved back to the average, profitability of hog producers would rise by about 40%.
We also note that hog producers continue to make important productivity gains. Hog producers have recently achieved a remarkable 10.03 piglets per birth cycle for the first time.(Commodity News for Tomorrow, 19 July) Additionally, significant advances in hog science are reducing the impact of disease and infant mortality. All of these advances have the potential to produce not only more hogs, but more profits.
Opportunities for investors in the year ahead probably include hog producers. Issues that might be considered for research are FEED, HOGS, and SFD, as well as others. While Asian Agri-Equities have been under attack this past year by some bears, those stocks seem to have put in an important bottom in June. In thinking about this matter, consider one question. How much more pork will be consumed annually by 1.4 billion China consumers five years from now?
By Ned W Schmidt CFA, CEBS
AGRI-FOOD THOUGHTS is from Ned W. Schmidt,CFA,CEBS, publisher of The Agri-Food Value View, a monthly exploration of the Agri-Food grand cycle being created by China, India, and Eco-energy. To contract Ned or to learn more, use this link: www.agrifoodvalueview.com.
Copyright © 2010 Ned W. Schmidt - All Rights Reserved
Ned W Schmidt Archive |
© 2005-2022 http://www.MarketOracle.co.uk - The Market Oracle is a FREE Daily Financial Markets Analysis & Forecasting online publication.


