


Twin Economic Problems: Employment and Consumer Spending
Economics / US Economy Sep 13, 2011 - 05:06 AM GMTBy: Asha_Bangalore

 The elevated unemployment rate remains at the top of the Fed’s worry list. Nearly as important is the recent trend of consumer spending. Bernanke’s speech of September 8 included an important takeaway on consumer spending:
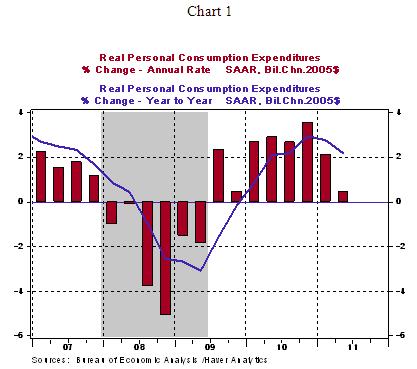
One striking aspect of the recovery is the unusual weakness in household spending. After contracting very sharply during the recession, consumer spending expanded moderately through 2010, only to decelerate in the first half of 2011. The temporary factors I mentioned earlier--the rise in commodity prices, which has hurt households' purchasing power, and the disruption in manufacturing following the Japanese disaster, which reduced auto availability and hence sales--are partial explanations for this deceleration. But households are struggling with other important headwinds as well, including the persistently high level of unemployment, slow gains in wages for those who remain employed, falling house prices, and debt burdens that remain high for many, notwithstanding that households, in the aggregate, have been saving more and borrowing less. Even taking into account the many financial pressures they face, households seem exceptionally cautious.
Real consumer spending posted a 3.2% year-to-year increase in November 2010 and has since remained positive but growing at a tepid pace. Consumer spending grew 2.3% from a year ago in July. In the first and second quarters of 2011, consumer spending increased 2.1% and 0.4%, respectively, (see Chart 1)
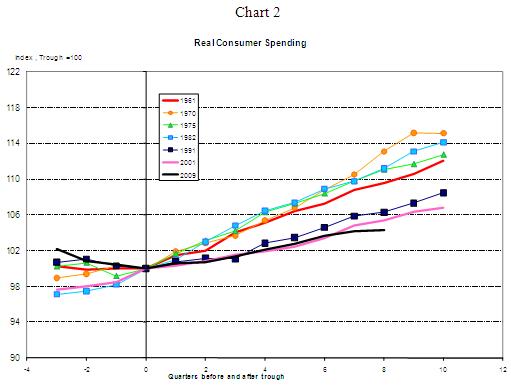
Historical data offer additional support to Chairman Bernanke’s uneasiness about the decelerating trend of consumer spending. Chart 2 is an index chart comparing the performance of consumer spending from the trough of a recession through the recovery/expansion phase of the business cycle. The chart limits the illustration to ten quarters following the end of a recession to keep the chart reader-friendly. In the index chart, consumer spending at the trough quarter is set equal to 100 and appropriate computations carried out for the subsequent quarters. Barring revisions of data, in the current recovery, consumer spending ranks at the bottom after eight quarters of economic growth (see Chart 2) compared with its peers since 1960. This poor performance is tied to soft employment conditions and balance sheet stress of households that Bernanke mentions. Consumer spending is the largest component of GDP and if the trajectory is not nudged in the right direction with suitable incentives or a sharp increase in hiring, the sub-par performance of the economy will persist.
EU Turmoil in 2011 vs 2010 – Anything Different in Market Metrics?
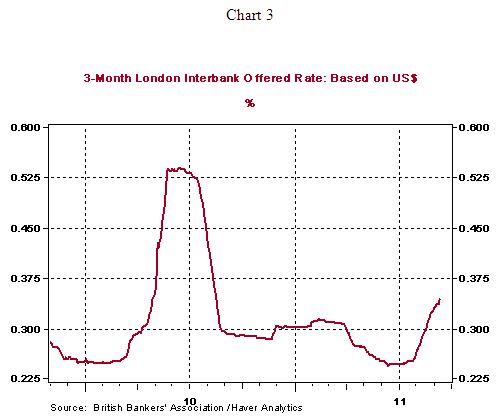
Greek debt issues are once again at the heart of the crisis unfolding in Euroland. The 3-month Libor hit 0.34% at market close today, up from 0.24% in July and 0.29% in August (see Chart 3). The 3-month Libor hit a high of 0.54% in June 2010 (see Chart 3). So, we are seeing a replay of 2010 for the most part. We are also seeing something different in 2011.
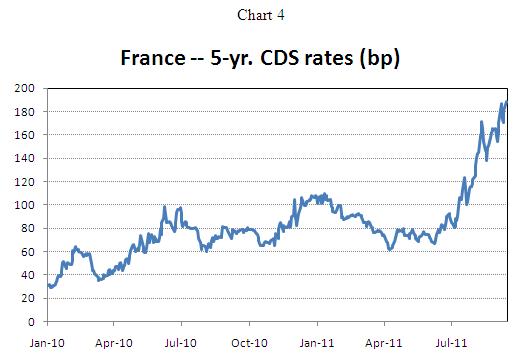
France and Germany are the large economic engines of the EU. However, the important change this time around is that markets view France differently. [James Pressler, Country Risk Analyst of Northern Trust, provided Chart 4 and 5]. The French 5-year sovereign CDS was quoted at 188.5 bps at market close today, which is higher than the pricing seen in 2010. At the height of the crisis in 2010, French sovereign CDS was priced at 100 bps (see Chart 4). Chart 5 depicts CDS quotes for Portugal, Spain, and Italy of the problem nations in addition to Germany and France during 2011. Greece is excluded in Chart 5 because the readings are significantly higher than that of the other nations.
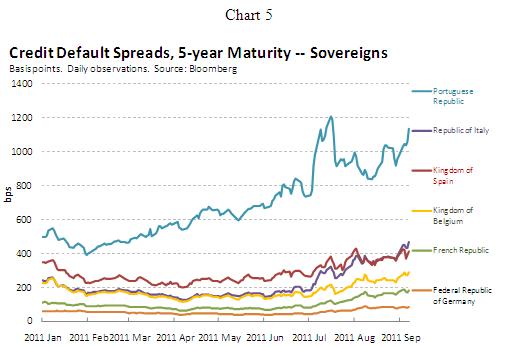
Note: CDS spread equates to the annual amount (in basis points) a protection buyer must pay the protection seller over the life of the contract. Daily pricing, at New York market close, is provided by Bloomberg (CBGN).
Asha Bangalore — Senior Vice President and Economist
http://www.northerntrust.com
Asha Bangalore is Vice President and Economist at The Northern Trust Company, Chicago. Prior to joining the bank in 1994, she was Consultant to savings and loan institutions and commercial banks at Financial & Economic Strategies Corporation, Chicago.
Copyright © 2011 Asha Bangalore
The opinions expressed herein are those of the author and do not necessarily represent the views of The Northern Trust Company. The Northern Trust Company does not warrant the accuracy or completeness of information contained herein, such information is subject to change and is not intended to influence your investment decisions.
© 2005-2022 http://www.MarketOracle.co.uk - The Market Oracle is a FREE Daily Financial Markets Analysis & Forecasting online publication.