


Wild Gyrations in Gold and Commodities
Commodities / Commodities Trading Jan 05, 2012 - 02:41 AM GMTBy: Gary_Dorsch

 If traders in the commodities markets were to check into a Psyche ward, the files would no doubt read "Bi-Polar" or Schizophrenic." This is so, because commodity traders have a habit of fixating on a set of data one day, and then quickly forgetting about the data the very next day, and re-focusing on something else. Market sentiment often turns on a dime, and without notice. This shifting of sentiment in commodity futures is nothing new, of course. That's why for decades, dabbling in commodities was considered too risky for most investors, since sentiment, by definition, is unpredictable and impossible to measure.
Bipolar disorder, describes a set of behaviors that causes people to have big swings between severe high and low moods, and switching from feelings of being overly happy and joyful to feelings of sadness and depression. Because of the highs and the lows -- the condition is referred to as "bipolar" disorder. In between episodes of mood swings, there are moments of so-called normalcy. Schizophrenia on the other hand is characterized by delusions, hallucinations, and incoherence, and is classified as a "thought" disorder while Bipolar Disorder is a "mood" disorder. In either case, these traits help to explain some of the reasons behind erratic price movements on a daily basis that vexes many retail traders.
In 2011, commodity traders started out with a positive frame of mind. The Federal Reserve's money printing operation, dubbed "QE-2," was running at full steam and flooding the world with cheap dollars. However, markets do not travel in straight lines. There are always zig zags along the way. There were numerous minefields that commodity traders had to navigate through, before reaching the finish line for 2011. There was the loss of Libya's oil output, an earthquake and tsunami in Japan, the Silver bubble, the collapse of the Greek bond market, the Bank of England's QE-2 scheme, the ECB's 11th hour rescue of the Euro-zone's banking system, and finally, signs that China's factory sector was sagging under the weight of Beijing's monetary tightening campaign and clampdown on real estate.
In recent years, the wild swings and volatility of the markets has become greatly magnified, due to the actions of high frequency traders (HFT), who specialize in day trading, - the buying and selling huge blocks of equities, often moving in sync with whatever direction the wind might be blowing on any given day. Two-thirds of the trading volume on the New York Stock Exchange and Nasdaq is now handled by computer programs, that doesn't require any human input. While equity markets are still the favorite den of speculation for HFT traders, many of these "black box" traders are now setting up shop in the commodities markets.
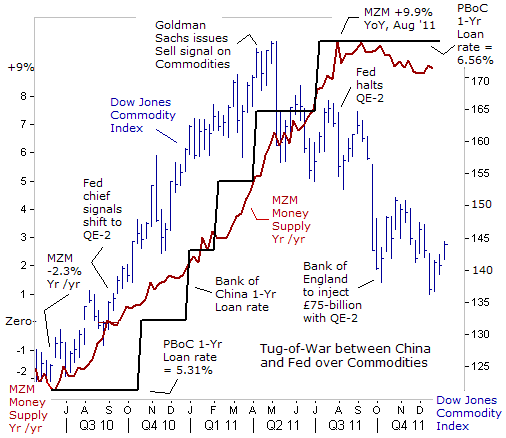
At the peak of the commodities boom in April 2011, about $412-billion was stashed away in managed commodity funds, buoyed by the Fed's radical QE-1 and QE-2 money printing schemes. The Fed's experiment with QE was a huge success, that is to say, the Fed was able to conjure-up the illusion an economic recovery by simply printing vast quantities of paper currency that was covertly channeled into the stock market through its agents on Wall Street. Furthermore, the Fed proved that it could prevent the specter of deflation, by cheapening the value of the US-dollar in relation to other currencies. For eight straight months, the Dow Jones Commodity index zig-zagged its way higher, as the Fed fulfilled its pledge to inject $600-billion of freshly printed US$'s into the coffers of the Wall Street Oligarchs.
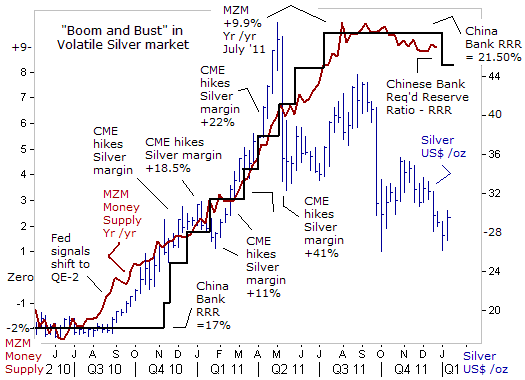
When the Fed first telegraphed its QE-2 scheme in August 2010, the high octane MZM money supply was languishing at a -2.3% annualized rate. By the time the Fed finished QE on June 30th, 2011, - MZM was expanding briskly at a +9.9% clip. Some traders reckoned the Fed was aiming to artificially inflate the value of the US-stock market, others figured the Fed was trying to spur Beijing into appreciating the value of the Chinese yuan at a faster rate against the US-dollar. Whatever the Fed's motives for QE-2, rioters soon began taking to the streets in Algeria, Jordan, Libya, Morocco, and Yemen, ostensibly aimed at toppling repressive governments, - but also expressing extreme anxiety and anger over skyrocketing food prices, that was fueled by hallucinogenic effect of QE on traders in London and New York.
Commodities are priced in US-dollars, and with the Fed flooding the world with dollars, traders piled into markets. Copper climbed to a record $10,000 /ton in London, North Sea Brent rose to $125 /barrel, Corn futures in Chicago hit $7.50 /bushel, Silver futures soared to $49.50 /oz, and rubber jumped to all-time peaks in Shanghai and Tokyo. Coffee, cotton, and sugar also soared to all-time highs. Tyson Foods' (TSN.N) chief operating officer predicted a "new norm" for corn prices at $7 a bushel that was pushing up costs for cattle, chicken and hog feeders. Corn prices had nearly doubled since the middle of 2010, and Tyson said it expected to spend $500-million more on grain in its fiscal 2011, a +13% increase over the roughly $4-billion the company spent on grain in 2010. Regardless, the Fed's policy remained unchanged; - aiming to inflate the value of the stock market with unlimited injections of liquidity and locking short-term interest rates at near zero-percent, which in turn, fanned wild-eyed speculation.
While the Fed wasn't scheduled to turn-off QE-2 until the end of June 2011, some commodity traders decided to jump off the QE-2 bandwagon a few months early. They figured that the bullish trade had become too crowded, and that the timing was ripe for a nasty shakeout. On April 12th, Goldman Sachs shocked the markets, by urging its clients to dump positions in crude oil, copper, cotton and platinum. On May 3rd, Societe Generale joined Goldman Sachs in warning of tougher times for commodities prices. "The conclusion of the second round of quantitative easing, (QE-2), will deprive commodities of a key ingredient of their winning streak," the French bank said. "This suggests that the commodities bull-run support by QE-2 may run out of steam in the third quarter if the global economy shows any signs of weakening. The end of QE-2 on June 30th could well herald the end of the commodities bull market. If emerging market economies slow and abundant liquidity dries up after QE-2, deflation fears may be back on the agenda in the second half of 2011," SocGen warned.
Two-days later, on May 5th, commodity markets were rocked by a nearly unprecedented onslaught of panic selling as modest early profit-taking snowballed into one of the worst days on record. In a slide reminiscent of the steep sell-off in the wake of the 2008 financial crisis, Brent crude oil dived a record $12 /barrel, and natural gas dropped over -7%. Tin was the biggest loser among industrial metals, shedding -7% to $28,500 /ton at one point. Chicago Corn fell -3% to $7.05 /bushel and soybeans fell -2.3% to $13.19 / bushel. Ironically, the May 5th plunge in commodities happened around the 1-year anniversary of the May 6th 2010 "Flash Crash," on Wall Street, when the Dow Industrials plunged -1,000-points.
Silver was the catalyst for the slide, tumbling by nearly $5 /oz, its biggest one-day dive since 1980. Prior to May 1st, the white metal was zooming higher in a speculative frenzy, touching an all-time high of $49.50 /ounce from around $18 /oz in late August 2010 when the Fed first telegraphed QE-2. Now however, Silver was on course for its steepest fall in almost 30-years, losing -27% in a single week to $35.287 on May 6th . Silver led the rout, undermined by the Chicago Mercantile Exchange's decisions to increase margins for new speculative positions by +245% in the prior weeks and months. After the May 2010 commodity plunge, fund managers were still divided over what direction prices were headed next.
The tug-of war in the commodity markets tipped in favor of the Bears in August, just as SocGen had predicted. While the Fed's QE-2 scheme was generally credited for fueling the speculative run-up in commodities, led by the Silver market, working against the bullish tide was the People's Bank of China (PBoC). While the Fed was launching QE-2 in Nov '10, the PBoC was draining 1-trillion yuan of liquidity from the Shanghai money market, by lifting bank reserve requirement ratios (RRR) 150-basis points to 19-perent. The PBoC was using calibrated hikes in banks' reserve requirement ratios (RRR) as its main tool to tackle the commodity price bubbles inflated by the Fed. The PBoC moved away from using open market operations, a mechanism it has relied on for years, to soak-up excess money. By June 2011, the PBoC had resolutely lifted RRR's to a record 21.5%, with each half-point increase draining 350-billion yuan out of the Shanghai money markets.
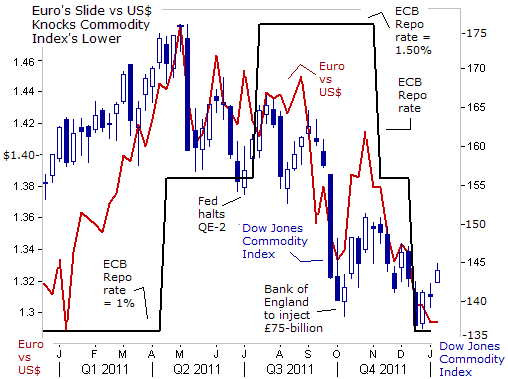
On July 7th, the ECB also took aim at the commodity Bulls, by hiking its overnight repo rate for the second time to 1.50%, as the Euro-zone's inflation rate ratcheted upwards to 3%. "Looking ahead, inflation rates are likely to stay above target in the coming months," warned former ECB chief Jean "Tricky" Trichet. " Upward pressure on inflation, mainly from energy and commodity prices, is also still discernible in the earlier stages of the production process. We will continue to monitor very closely all developments with respect to upside risks to price stability," he added, leaving the door open for a third rate hike later in the year.
Yet another big impetus for a sharp slide in commodity markets in the second half of 2011, were widespread fears that the Euro currency union might break apart, and the upward spiral in Euro-zone bond yields could plunge Europe into a severe recession, - thus denting demand for commodities. The catalyst was the Greek bond market, which collapsed amid widespread recognition that Athens was insolvent, and couldn't repay € 370-billion debts. Contagion sales of Euro-zone bonds soon spread from the peripheral Greek, Irish, and Portuguese bond markets, to hit the core of the Euro-zone - Italy and Spain. Soon afterwards, spurred by a sharp slide in the Italian and Spanish bond markets, the Euro fell to the psychological $1.300-level, which in turn, triggered selling in the base metals, grains, and soft commodities.
Italy became the epicenter of the Euro-zone's debt crisis. Suddenly, the US-dollar began to look less ugly than the Euro. If handled badly, a disorderly rout in the Italian bond market, - the world's third largest debtor with €1.9-trillion in public debt and €3.5-trillion in total debt, equaling a total of 310% of its GDP, could trigger the collapse the Euro-zone's banking network and usher in a world wide credit crunch. European banks have historically been large players in issuing letters of credit, used to finance global trade over the high seas. European banks have a strong presence in emerging markets such as Latin America and Asia, and provide for more than a third of trade finance loans worldwide.
The commodities markets got a reprieve from the selling onslaught, on October 6th, when the Bank of England (BoE) said it would inject a further £75-billion into the London money markets through January 2012, effectively monetizing the government's debts, and increasing the size of its QE-2 money printing scheme to £275-billion. The Dow Jones Commodity index rebounded +10% in October , based on ideas that the Fed would soon follow the BoE's lead, and launch a third round of QE, that could total as much as $550-billion.
Still, there are many moving parts that can impact the price of globally traded commodities. China has the most populous nation on the planet, with more than 1.3-billion people. It is also one of the most rapidly developing countries, logging an annualized +9% growth rate for the past 20-years. The developed nations in North America and Europe are smaller in terms of population, and their economies are expanding more slowly, if at all. So emerging markets in general and China in particular, have the greatest influence over commodity prices. China is acknowledged to be the world's largest importer of copper, cotton, gold, rubber, iron ore, soybeans, zinc, and the second largest consumer of corn and crude oil.
There is a significant amount of guesswork that goes into quantifying the exact share of China's demand for global commodities. Furthermore, trying to accurately determine at what speed the Chinese economy is expanding is also difficult. Many private economists have cast doubt on the reliability of Chinese economic statistics. The biggest problem today is that Beijing is fudging numbers in the name of politics, and that statisticians miss huge segments of the private sector, which don't get counted in any surveys.
China is both the world's largest consumer and producer of raw steel, and along with other key industries such as automotive, textile, and petrochemical industries, its steel output is considered a key barometer of its overall economy. Over the past 30-years, China's steel production has increased at a rapid pace as the Middle Kingdom has industrialized and urbanized. The expansion of steel production, particularly over the past decade, has been a significant driver of China's demand for raw materials, especially iron ore and coking coal. This has resulted in a huge increase in China's imports of these commodities.
China now accounts for 45% of global steel production, which is significantly higher than its share of 15% at the start of the decade. China is itself a major producer of iron ore and possesses extensive reserves. However, these reserves have relatively low average iron content at around 33%, compared with 62% in Australia and around 65% in Brazil and India. This lower iron content makes it more expensive to process. Strong demand for steel has seen the imported share of China's iron ore supply increase from around 10% in the late 1980's to more than 50% currently . In recent years, more than 80% of China's iron ore imports have come from Australia's top miners, Brazil's Vale, and India.
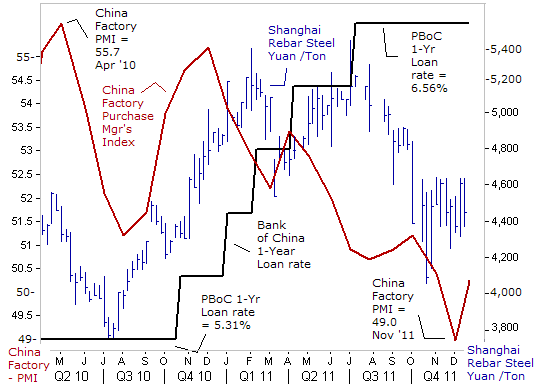
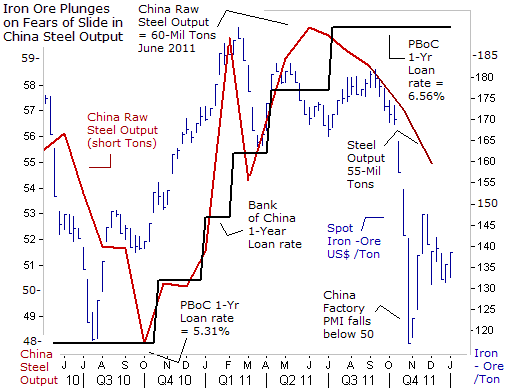
So when China's government reported that the country's output of raw steel had fallen to 55-tons in November, and -9% less than the 60.25-million tons produced in May, it set off alarm bells. Traders began to conjure-up fears that China's economy was slowing at a much faster rate than expected. Exaggerated fears of a "hard landing," made plausible by the unrelenting slide in the Shanghai red-chip market, triggered a sharp plunge in the price of iron ore to as low as $116 /ton, after spending much of the year between $165 and $185 /ton.
Steel futures traded in Shanghai slumped to around 4,450-yuan a ton, after falling to as low as 4,100 yuan in October, spooked by a slide in the official purchasing managers' index (PMI), - the earliest indicator of China's industrial activity. The factory PMI fell below the 50-mark in November for the first time since early 2009. Slower demand for steel would cut China's appetite for iron ore. Nearly 91% of the crude steel produced in China comes from integrated mills, which use iron ore as primary ingredient.
According to the China Daily, housing prices are up +140% nationwide in China since 2007 and, more importantly, eightfold in major cities like Beijing over the last eight years. Real estate construction is a major driver for steel, using 54% of supply. Overall, as much as 25% of China's economy may be tied up in real estate and related industries. The danger of a too tight monetary policy is a deflating real estate bubble that if it occurred, would result in bankruptcies of builders, big loan losses to banks, and much slower economic growth. However, such exaggerated fears never seem to actually materialize.
The effects of a sharp slowdown in construction in China would adversely impacts prices for cement, steel, copper and other raw materials traded on world markets. It's estimated that if China's economic growth rate would slow to around +5%, it could weaken demand for imported commodities by -20-percent. Iron ore accounted for 73% of Australia's miner Rio Tinto's 2010 earnings, compared to a 40% contribution for # 3-miner BHP Billiton. Yet every ton of crude steel production also requires 600-kilograms of coking coal. BHP Billiton is the world's biggest producer of coking coal. And since iron ore and coking coal are Australia's biggest export earners, they are closely watched by traders in the Australian dollar.
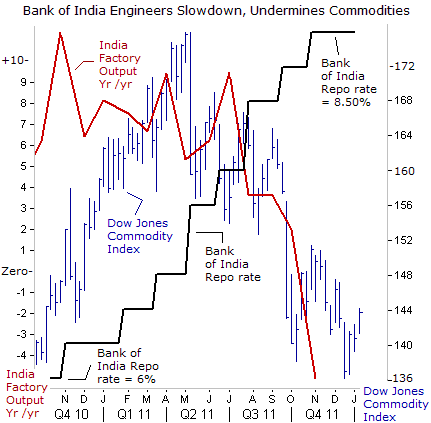
India 's economic growth rate skidded to +6.9% in the July-September quarter, from +8.5% last year, and is forecast to slow further amid a worsening global outlook. High inflation fueled in part by QE schemes in England, Japan, and the US, forced India's central bank to hike interest rates 13-times, for a total of 375-basis points since March 2010, to 8.50% in October. Policy inertia and corruption scandals have also slowed the flow of crucial foreign investment and knocked the Indian rupee to record lows. European banks - which provide about $150-billion, or over 50% of foreign currency loans to Indian companies, are starting to pull back, making it harder to finance foreign trade, with a shrinking availability of letters of credit. India 's industrial output fell -5.1% in October compared with a year earlier, going negative for the first time in two years, and rattling the commodities markets.
Gold imports by India, the world's top consumer, plunged -56% to 125-tons in the fourth quarter, cutting full-year imports by 8.4% to about 878-tons of gold in 2011, down from 958-tons in 2010, the Bombay Bullion Association said on Jan 2nd. The World Gold Council had predicted that India would buy about 281-tons in the fourth quarter, taking total imports over 1,000-tons. However, due to record high prices and high interest rates, Indian traders became net sellers of Gold in the fourth quarter. In local currency terms, the price of Gold gained +26% in 2011, due to a -16% drop in the value of the rupee against the US$.
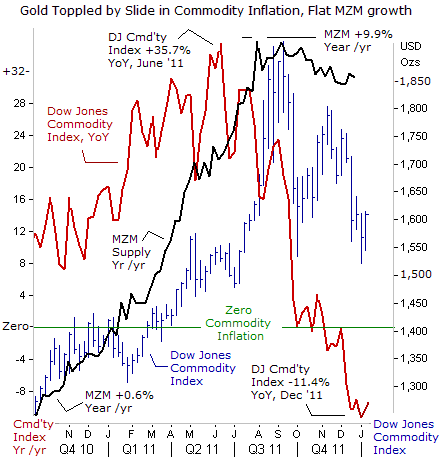
The historic Gold rally, lasting for 11-straight years of gains, squeaked out a +10% gain in 2011 versus the US$. But since peaking in late August, Gold stumbled to the threshold of a Bear market, tumbling -20% lower from its record high of $1,924 /oz. In hindsight, Gold topped out soon after the Fed halted QE-2, - MZM, began to flatten out and receded a bit, after many months of explosive growth. The US-dollar's rally against the Euro, combined with monetary tightening campaigns in Brazil, China, Chile, the Euro-zone, India, and Russia, all contributed to a broad sell-off in the commodity indexes, and sweeping Gold lower.
The Dow Jones Commodity Index, - utilized as a measure of real-time inflationary pressures in the global economy, began to tumble significantly in the second half of 2011. The inflationary pressures that were bubbling in the first half of last year - began to rapidly unwind in the second half. By year's end, the Dow Jones Commodity Index closed at the 140-level to stand -15% lower for the year. Official government statistics on inflation should ratchet downward in the months ahead to reflect lower commodity prices. Gold traders are several steps ahead, having already discounted a lower global inflation rate, by knocking Gold to $1,565 /oz. .
So What's Next, "It's tough to make predictions, especially about the future," -- Yogi Berra used to say. There are many moving parts from around the world that can influence commodity markets at any given point in time. As such, traders often exhibit both bi-polar and schizophrenic behavior, making forecasts a hazardous business. However, there are signals that the latest slide in the Dow Jones Commodity Index has descended to low enough levels to persuade Bargain hunters to bid for several key commodities. Traders are watching for signs that Chinese importers are taking advantage of the recent sharp slide in commodities, in order to re-stock their depleted inventories.
Chinese users of cotton started buying the white fiber in mid-October after it fell below $1 /pound. Cotton plunged from a record high of $2.25 last March, and skidded to 85-cents. Beijing purchased 2.1-million tons of cotton below $1 /lb for its reserves. US-farmers are expected plant -15% less cotton this year, since market prices are below break-even costs at roughly, $1 /pound. Cotton has rebounded to 96-cents /lb, but could be a laggard among the commodity sector in 2012. Sugar futures are more promising, and rallied +5% to start the New Year, with volume surging to around 103,000-lots, or nearly double the 30-day average. Spillover strength for sugar stemmed from broad based buying of commodities, especially North Sea Brent crude oil, which averaged $110 /barrel for all of 2011.
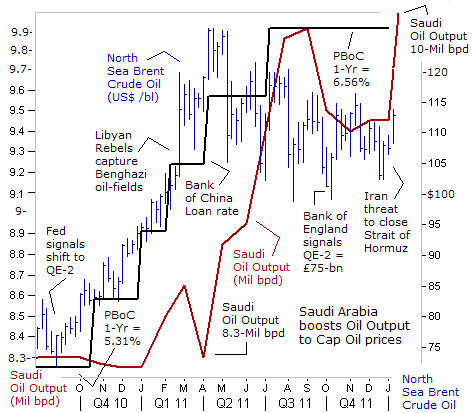
North Sea Brent crude oil found a floor at $100 /barrel last year, buoyed by "quantitative easing" in England, Japan, and the US. Thanks to QE, the price of crude oil is roughly $25 /barrel higher than otherwise. To counter the inflationary effects of QE, the People's Bank of China hiked its overnight loan rate +124-bps higher to 6.56%, in order to drain liquidity and cool its economy's demand for crude oil. Also, Saudi Arabia, the central banker of crude oil, boosted its daily output to 10-million barrels per day, to offset the loss of Libyan oil, and to allow Asian and Western clients to build-up their oil stockpiles.
In the not so distant future - indeed perhaps only months from now - the US Treasury and Europe may enact a mix of sanctions against the Central Bank of Iran (CBI) as part of an effort to convince Tehran to abandon its nuclear weapons program. Sanctions against the CBI would leave Iran's oil customers without any way to pay for their crude, effectively triggering a partial boycott on Iranian oil exports. A European embargo of 450,000-bpd of Iranian crude oil would constitute a new phase of economic confrontation between Iran and the West. In response, Iran has repeatedly threatened to close the Strait of Hormuz.
Saudi Arabia , Kuwait and the United Arab Emirates, are expected to increase their oil exports to the European Union and Asian nations once sanctions on Tehran's energy exports and its central bank begins in the coming months. There's also discussion with emerging oil exporters, such as Libya, Iraq, Ghana and Angola, to increase their production capacities to guard against any shortages caused by the West's embargo against Iran. Oil traders are taking note, and have bid-up the price of Brent crude oil to $113 /barrel.
Oil prices could quickly surge far above last year's high of $125 /barrel, if Tehran makes good on its threats to bomb the Strait of Hormuz. After 10-days of naval exercises by Iran in the Gulf, Iran's army chief Major General Ataollah Salehi issued a stern warning, "Iran advises, recommends and warns the US not to move its carrier back to the previous area in the Gulf because Iran is not used to repeating its warnings and warns just once." Many traders brushed-off Salehi's comments as empty rhetoric, and instead, poured more than $1-trillion into world equity markets on the same day. Yet other traders saw the situation differently. The US-dollar soared +30% in a single day to 17,800-Iranian Rials, and the price of Gold jumped $50 /oz to as high as $1,615 /oz. If crude oil turns sharply higher, it could also boost the price of corn, ethanol, heating oil, gasoline, rubber, silver, and sugar.
Corn prices stabilized below $6 /bushel and attracted strong buying interest from the industrial farm factories and feedlots. Last year, a staggering 33.5-million cows, 110-million hogs, and 9.3-billion chickens were slaughtered in US-processing plants. Each pound of beef produced requires 6.5-pounds of corn for feed. Production of ethanol hit a record high last year, and is consuming 40% of the US corn supply. Corn futures in Chicago rebounded by 10% higher over the past 2-weeks to $6.58 /bushel, as harsh weather threatened crop production in South America. US-corn stockpiles already whittled to 15-year lows. Soybean futures also jumped +10% higher in the past two weeks, to around $12.20 /bushel.
Corn and Sugar are becoming increasingly linked in the global markets. With their dual usage in sweeteners and bio-ethanol, increasingly sugar is looking more and more like corn . Brazil , the top sugar producer, is shifting more of its cane output to sweeteners, rather than bio-fuels. This has left Brazil, historically the top Ethanol exporter, on track to become a net importer of US-corn based Ethanol in the year ahead. Coffee futures could turn higher, after Vietnam, the world's second-biggest coffee producer after Brazil, said it expects to cut its supply by around 20% in the year ahead to 1.1-million tons.
Chinese steel mills started buying iron ore last month, after prices briefly fell towards $120 /ton, to replenish stockpiles before their New Year holidays start on January 22nd. India's government is unhappy with the current low level of iron ore prices, and is engineering a sharp reduction in foreign sales by hiking export taxes �percent. Iron ore prices have since rebounded by+10% to $140 /ton, bolstered by an uptick in China's factory PMI to 50.3.
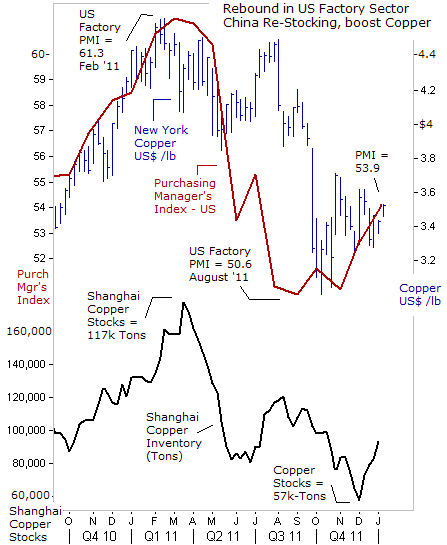
Copper rebounded to $3.52 /pound on the first day of trading in 2012, after finding strong handed buyer in the low $3 /lb area in the fourth quarter. Traders in Shanghai are restocking copper, after local supplies were whittled down to a 2-½-year low at 57,000-tons. The US-factory sector expanded in Q'4 at its fastest pace in six months, led by a rise in new orders for factory made goods, apparently immune to Europe's economic slump and triple-digit oil prices. US home building is on the upswing, supporting copper prices.
It's an election year for the presidency in the United States, and 15 out of 17 Treasury bond dealers predict the Fed will unleash QE-3 in the months ahead. If correct, QE-3 would provide a major shot of adrenalin for commodity markets and precious metals. Already, the European Central Bank has embarked on "backdoor QE," and is flooding the European banking system with a tsunami of Euros. Ironically, a weaker Euro led to a weakening of commodity prices in 2011, but that faulty linkage could begin to break down soon.
Downside risks to commodities and precious metals include a deeper than expected recession in Europe and so-called "hard landing" for China's economy. However, central banks in China and the Emerging nations are expected to counter any sharp downturn in the global economy, by lowering their lending rates, and joining the G-5 central banks by liquidity into the markets. For precious metals, it'll be another wild rollercoaster ride. Gold and Silver are expected to track commodity indexes, and finish higher with respectable gains in 2012.
Looking at the big picture, the "Commodity Super Cycle" that began 10-years ago has been interrupted for the short-term, but still remains intact for the longer-term, - a cycle that could extend for at least another decade. Each day, the world's population increases by 225,000-human beings. By 2030, the world's GDP is expected to double in size to $130-trillion, assuming a +3.5% annual growth rate. Such massive demands on the earth's finite resources will eventually outpace supply and lead to severe shortages of many commodities worldwide. Tighter supplies would be rationed through much higher prices.
This article is just the Tip of the Iceberg of what’s available in the Global Money Trends newsletter. Subscribe to the Global Money Trends newsletter, for insightful analysis and predictions of (1) top stock markets around the world, (2) Commodities such as crude oil, copper, gold, silver, and grains, (3) Foreign currencies (4) Libor interest rates and global bond markets (5) Central banker "Jawboning" and Intervention techniques that move markets.
By Gary Dorsch,
Editor, Global Money Trends newsletter
http://www.sirchartsalot.com
GMT filters important news and information into (1) bullet-point, easy to understand analysis, (2) featuring "Inter-Market Technical Analysis" that visually displays the dynamic inter-relationships between foreign currencies, commodities, interest rates and the stock markets from a dozen key countries around the world. Also included are (3) charts of key economic statistics of foreign countries that move markets.
Subscribers can also listen to bi-weekly Audio Broadcasts, with the latest news on global markets, and view our updated model portfolio 2008. To order a subscription to Global Money Trends, click on the hyperlink below, http://www.sirchartsalot.com/newsletters.php or call toll free to order, Sunday thru Thursday, 8 am to 9 pm EST, and on Friday 8 am to 5 pm, at 866-553-1007. Outside the call 561-367-1007.
Mr Dorsch worked on the trading floor of the Chicago Mercantile Exchange for nine years as the chief Financial Futures Analyst for three clearing firms, Oppenheimer Rouse Futures Inc, GH Miller and Company, and a commodity fund at the LNS Financial Group.
As a transactional broker for Charles Schwab's Global Investment Services department, Mr Dorsch handled thousands of customer trades in 45 stock exchanges around the world, including Australia, Canada, Japan, Hong Kong, the Euro zone, London, Toronto, South Africa, Mexico, and New Zealand, and Canadian oil trusts, ADR's and Exchange Traded Funds.
He wrote a weekly newsletter from 2000 thru September 2005 called, "Foreign Currency Trends" for Charles Schwab's Global Investment department, featuring inter-market technical analysis, to understand the dynamic inter-relationships between the foreign exchange, global bond and stock markets, and key industrial commodities.
Copyright © 2005-2011 SirChartsAlot, Inc. All rights reserved.
Disclaimer: SirChartsAlot.com's analysis and insights are based upon data gathered by it from various sources believed to be reliable, complete and accurate. However, no guarantee is made by SirChartsAlot.com as to the reliability, completeness and accuracy of the data so analyzed. SirChartsAlot.com is in the business of gathering information, analyzing it and disseminating the analysis for informational and educational purposes only. SirChartsAlot.com attempts to analyze trends, not make recommendations. All statements and expressions are the opinion of SirChartsAlot.com and are not meant to be investment advice or solicitation or recommendation to establish market positions. Our opinions are subject to change without notice. SirChartsAlot.com strongly advises readers to conduct thorough research relevant to decisions and verify facts from various independent sources.
Gary Dorsch Archive |
© 2005-2022 http://www.MarketOracle.co.uk - The Market Oracle is a FREE Daily Financial Markets Analysis & Forecasting online publication.