Apple Stock Vulnerable
Companies / Company Chart Analysis Apr 21, 2012 - 08:01 AM GMTBy: Mike_Paulenoff
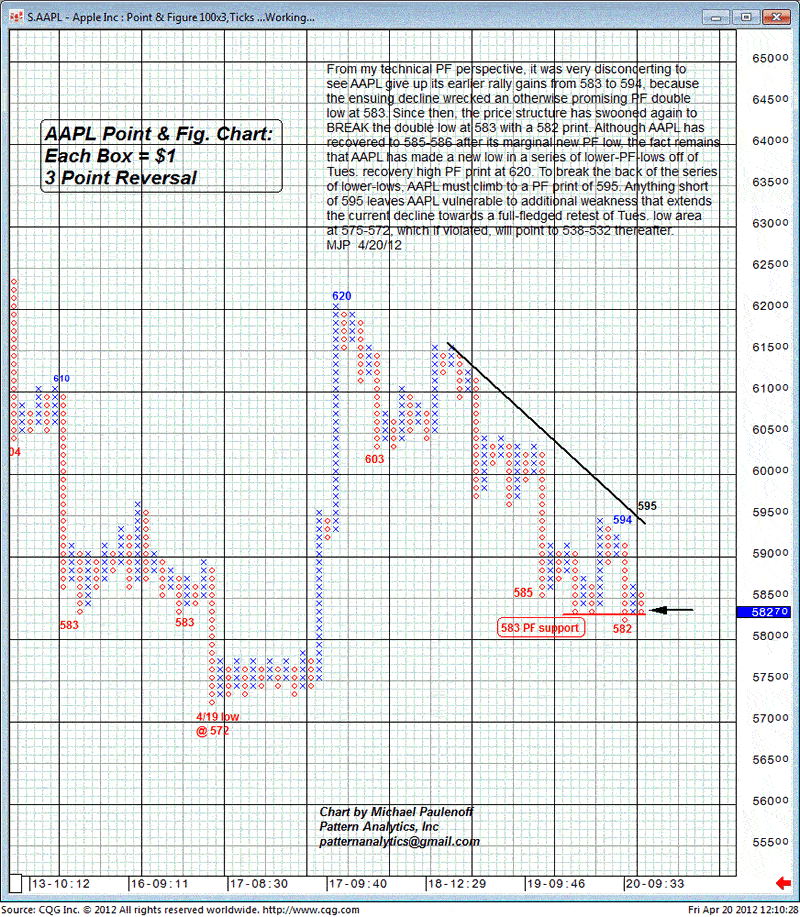
From my technical, point-and-figure chart perspective, it was very disconcerting to see Apple (AAPL) give up its earlier rally gains from 583 to 594, because the ensuing decline wrecked an otherwise promising PF double low at 583.
Since then, the price structure has swooned again to break the double low at 583 with a 582 print. Although AAPL recovered to 585-586 after its marginal new PF low, the fact remains that AAPL has made a new low in a series of lower-PF-lows off of Tuesday's recovery high PF print at 620.
To break the back of the series of lower-lows, AAPL must climb to a PF print of 595. Anything short of 595 leaves AAPL vulnerable to additional weakness that extends the current decline towards a full-fledged retest of Tues. low area at 575-572, which if violated, will point to 538-532 thereafter.

Sign up for a free 15-day trial to Mike's ETF & Stock Trading Diary today.
By Mike Paulenoff
Mike Paulenoff is author of MPTrader.com (www.mptrader.com), a real-time diary of his technical analysis and trading alerts on ETFs covering metals, energy, equity indices, currencies, Treasuries, and specific industries and international regions.
© 2002-2012 MPTrader.com, an AdviceTrade publication. All rights reserved. Any publication, distribution, retransmission or reproduction of information or data contained on this Web site without written consent from MPTrader is prohibited. See our disclaimer.
Mike Paulenoff Archive |
© 2005-2022 http://www.MarketOracle.co.uk - The Market Oracle is a FREE Daily Financial Markets Analysis & Forecasting online publication.


