


Gold, Oil, Metals, Agricultural Commodities Bull Market Appears to Have Ended
Commodities / Commodities Trading Jun 25, 2012 - 11:57 AM GMTBy: Tony_Caldaro

 We had been bullish on the entire commodity sector until the 2002-2007 equity bull market ended, and turned bearish in early 2008. After the crash in 2008 commodities, and equities, hit a significant low in early 2009. For commodities we labeled that low as Primary wave A of an ongoing bear market. A rising Primary wave B was then underway. Since several of the sectors in the commodity market had not completed their bull markets yet. We expected this B wave could retrace a good portion of the A wave decline. It did not!
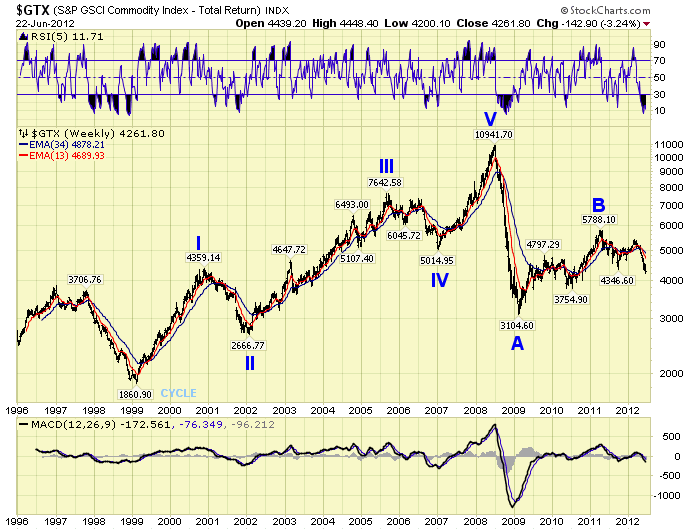
While commodity prices, in general as measured by the GSCI index, nearly doubled during the B wave portion of the bear market. The retracement of wave A was quite small, only 30%. We expected something more in the neighborhood of a 50% to 61.8% retracement to around 7500. In light of recent fundamental developments, the wave pattern, and the long term trends. We are now expecting the ongoing bear market in commodities to impact all of its sectors to the downside. Primary wave C in the GSCI index is underway.
The GSCI index is comprised of five sectors: energy, agriculture, basic metals, livestock, and precious metals in descending order of importance.
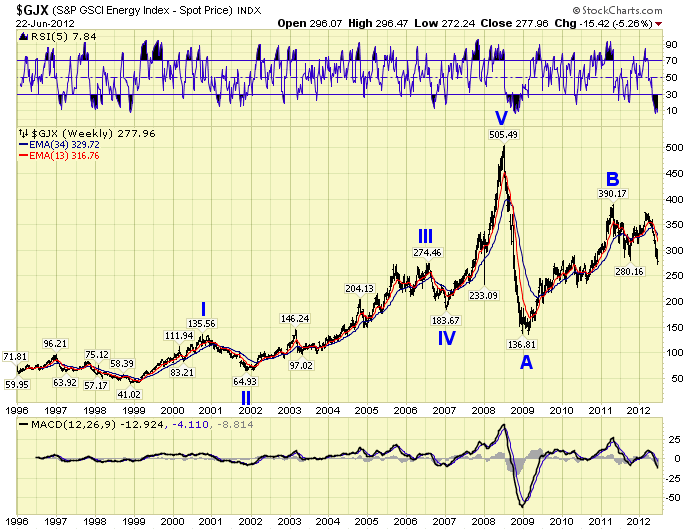
The Energy sector did much better overall. Rising nearly three-fold from the 2009 low. But its Primary C wave down was recently confirmed, and energy prices should now continue to decline long term.
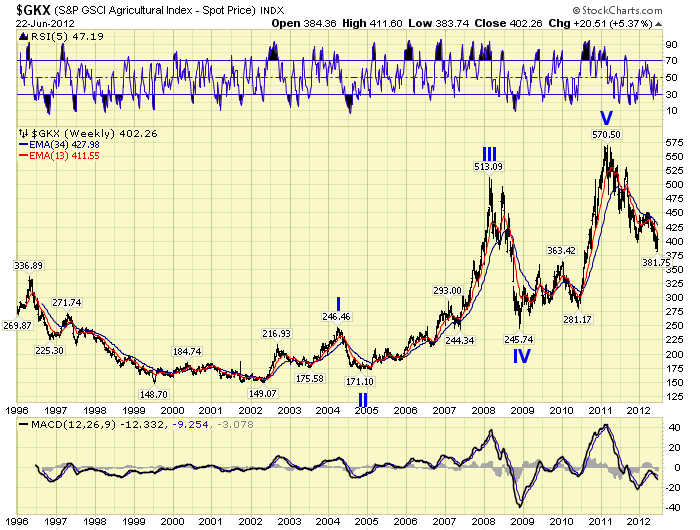
The Agricultural sector was a bit late in starting its bull market in 2002. As a result it made bull market highs in 2011. It is now in a confirmed bear market.
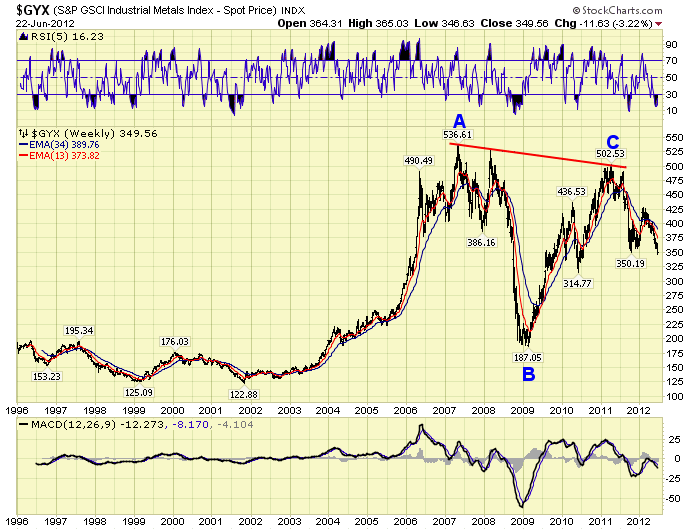
The Basic metals sector had quite an odd bull market. It made a Primary wave A top in 2007, crashed into early 2009 in a Primary B, then rose more than 2.5-fold into a failed Primary wave C in 2011. It recently confirmed a bear market as well.
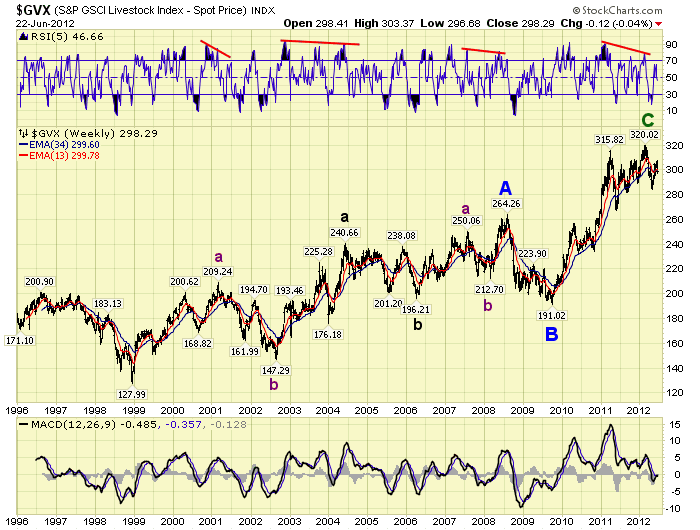
The Livestock sector looks like the classic commodity bull market. An abc Primary wave A structure from 1998-2008, a Primary B wave selloff, then a strong blowoff rally for Primary wave C. While this sector has not confirmed a bear market, technicals suggest one is likely underway.
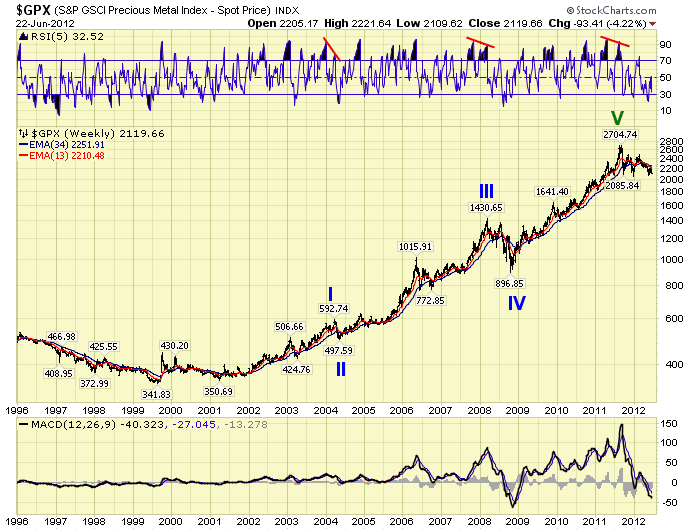
Finally, and the most disappointing from our perspective, the Precious metals sector. As you are aware, we chose to ignore the actual price low in 1999 and just track the bull market from 2001 forward. This worked out quite well as there were five waves up during that period. We were also expecting a 13 year bull market overall. Notice, most of the sector bull markets were only 10 years or less, with the exception of the Livestock bull market which has lasted 14 years.
Over the past fews months, since the 2011 high, Gold specifically has been creating wave patterns it had not displayed since the previous bear market. This, as you are aware, has given us reason for concern. When we look back at the bull market from 2001 we observe a demand driven commodity boom from 2001-2008. Then the commodity bust in 2008. This was followed by another explosive rally in Gold up until September 2011. So what exactly occurred to ignite this powerful move in Gold, and why isn’t it continuing?
The actual price low of Primary IV occurred in October 2008. The exact month the FED initiated QE1. While QE1 and QE2 were underway the FED’s balance sheet expanded from $800 bln to $2.8 tln. Gold, which maintains its value in USD’s, rallied from $681 in Oct08 to $1577 in May11. After a correction into early July11 at $1478 Gold soared again with expectations of a QE3. When September rolled around and the FED announced Operation Twist instead, Gold sold off rapidly. Experiencing the largest three day price decline ($1819-$1535) since the bull market began. Since then Gold has remained in a trading range between roughly $1525 and $1800. This week there were high expectations for QE3 again. But the FED only expanded Op Twist from $400 bln to $667 bln. Gold ended the week only about $45 above its recent $1527 low. And, the choppy price activity from that low does not look like a new uptrend is underway.
After the FED announcement this wednesday the GSCI index, and the three highest weighted sectors all dropped into bear market territory. Confirming the resumption of their bear markets. Silver, which peaked just before QE2 ended, appears to be in a bear market as well. It certainly looks like Operation Twist effectively ended the commodity bull market across the board.
CHARTS: http://stockcharts.com/...
http://caldaroew.spaces.live.com
After about 40 years of investing in the markets one learns that the markets are constantly changing, not only in price, but in what drives the markets. In the 1960s, the Nifty Fifty were the leaders of the stock market. In the 1970s, stock selection using Technical Analysis was important, as the market stayed with a trading range for the entire decade. In the 1980s, the market finally broke out of it doldrums, as the DOW broke through 1100 in 1982, and launched the greatest bull market on record.
Sharing is an important aspect of a life. Over 100 people have joined our group, from all walks of life, covering twenty three countries across the globe. It's been the most fun I have ever had in the market. Sharing uncommon knowledge, with investors. In hope of aiding them in finding their financial independence.
Copyright © 2012 Tony Caldaro - All Rights Reserved Disclaimer: The above is a matter of opinion provided for general information purposes only and is not intended as investment advice. Information and analysis above are derived from sources and utilising methods believed to be reliable, but we cannot accept responsibility for any losses you may incur as a result of this analysis. Individuals should consult with their personal financial advisors.
© 2005-2022 http://www.MarketOracle.co.uk - The Market Oracle is a FREE Daily Financial Markets Analysis & Forecasting online publication.