Playing the Long-term Trends in Stocks
Companies / Company Chart Analysis Nov 29, 2012 - 10:57 AM GMTBy: David_Banister
How many times have you bought a stock and then a few weeks perhaps have gone by and you get frustrated with lack of real net movement? You see all kinds of other stocks moving every day and finally you give up, sell your stock and go chase another one. Inevitably what happens in many cases is you find out later that your instincts were right and your research was correct, as the stock you gave up on finally takes off leaving you frustrated.
Sometimes it helps to understand the long term picture of a stock cycle and try to determine where you may be at in the big picture. This way you may be more willing to sit on a stock a bit longer, understanding it may need some time to work off a prior large move to the upside. Stocks often consolidate in fibonacci periods of time, as those revolve mainly around sentiment related to the stock or the company itself. You can see big up moves that come out of nowhere and last for several weeks, and then many weeks of consolidation or mild decline. These are actually crowd behavioral movements playing out as sentiment swings from too bearish to overly bullish and back again.
In the sample below we outline ASPS, a strong growth company in the right sector at the right time. We can’t be sure that this stock will break out to the upside, but we do like the fundamentals and the catalysts ahead. At ATP we look for both technical and fundamental marriages as it were, and then do our best to time the entry and exits accordingly. ASPS plans to spin out two divisions as a stock dividend to shareholders in the next 30 days or so, and we think that will catalyze the shares as sentiment turns north.
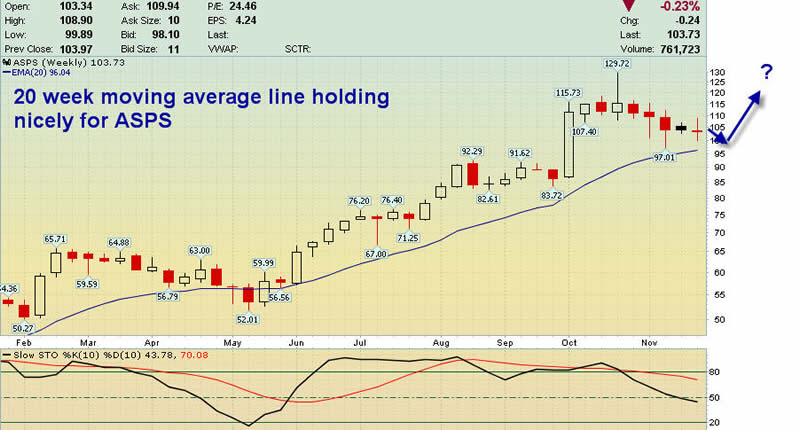
In the meantime, the stock trades between 100 and 107 per share frustrating anyone who expects an immediate pop. Taking a look at a multi month chart with weekly views we can see that this actually has been consolidating for several weeks in a normal pattern. In this case the 20 week moving average line seems to be the bogey for this stock cycle for ASPS, and as we approach that line we may see a shift back north in sentiment. Should we be wrong, we will know if the stock breaks down materially from this crowd pattern in play now.

Above is the chart as of November 29th, let’s see how it plays out: Be sure to read our article about “Buying in the Trenches” as well. Disclosure: Our ATP service has recommended a long position in ASPS within the past few weeks.
Go to ActiveTradingPartners.com and subscribe by using coupon code AD499ATP in the coupon code field at the bottom of the sign up form. Sign up for quarterly and the discount will be applied at checkout, and you will get The Market Trend Forecast for free as well.
Dave BanisterCIO-Founder
Active Trading Partners, LLC
www.ActiveTradingPartners.com
TheMarketTrendForecast.com
Dave Banister is the Chief Investment Strategist and commentator for ActiveTradingPartners.com. David has written numerous market forecast articles on various sites (MarketOracle.co.uk, 321Gold.com, Gold-Eagle.com, TheStreet.Com etc. ) that have proven to be extremely accurate at major junctures.
© 2012 Copyright Dave Banister- All Rights Reserved
Disclaimer: The above is a matter of opinion provided for general information purposes only and is not intended as investment advice. Information and analysis above are derived from sources and utilising methods believed to be reliable, but we cannot accept responsibility for any losses you may incur as a result of this analysis. Individuals should consult with their personal financial advisors.
© 2005-2022 http://www.MarketOracle.co.uk - The Market Oracle is a FREE Daily Financial Markets Analysis & Forecasting online publication.


