


QE4, The Fed's Fantastic Failure
Interest-Rates / Quantitative Easing Dec 16, 2012 - 02:51 PM GMTBy: Clif_Droke

 Question: When is an unprecedented economic event tantamount to a non-event? Answer: When another Fed intervention is announced.
The U.S. Federal Reserve bank announced this week the commencement of a new round of Treasury purchases to the tune of $45 billion a month to replace the expiring Operation Twist. This is in addition to the recently launched QE3 program that committed the Fed to buying $40 billion a month in mortgage-backed securities. The grand total of these central bank interventions amounts to some $1 trillion a year in government debt markets.
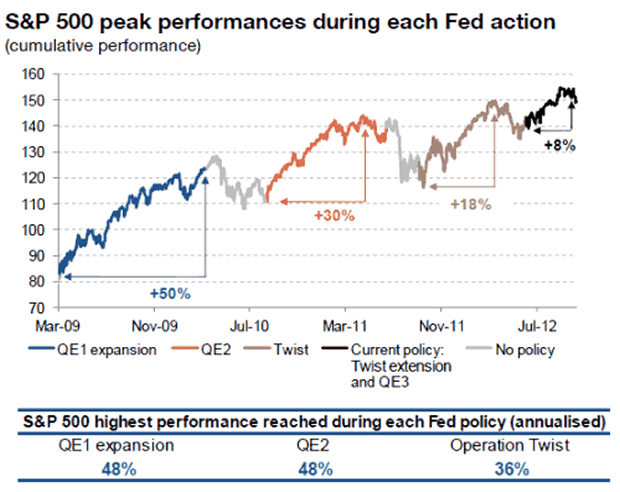
Financial markets were largely unimpressed with the announcement of QE4, essentially reversing what had been an impressive rally in stocks on the day of the Fed's policy meeting. This marks the second time in a row that investors have basically yawned at the commencement of another quantitative easing (QE) program, and for good reason: each successive QE has been followed by diminishing returns in the stock market. The following graph illustrates the diminution of returns since QE1 was expanded in 2009.
Aside from announcing a new round of bond buying, Fed Chairmain Bernanke also announced that the Fed has modified its guidance, noting its ultra-accommodative stance will remain in place until the unemployment rate falls below 6.5% and inflation projections remain no more than half a percentage point above 2% two years out. This improved upon the Fed's previous assertion that low rates would continue until 2015.
The purpose behind the Fed's Treasury purchases isn't as much to directly stimulate economic growth as it is to keep interest rates at rock bottom until real estate - the chief economic lynchpin - can fully recover. The Fed's hope is that the housing recovery which has been slowly gaining traction will accelerate in 2013 and beyond. There are good reasons, however, for believing this hope will prove misleading.
The above graphic shows the decreasing effectiveness of the Fed's quantitative easing programs over the last 3+ years. You'll notice that 2009 saw the biggest gain in the stock market of 50%, followed by QE2 in 2010 which saw a 30% gain in the S&P 500. This was followed by Operation Twist in 2011 which ushered in an 18% gain. All of these gains were helped by the cyclical factors behind the Fed's control.
For instance, the powerful 10-year cycle was peaking into late 2009. This accounted for much of the gains equities saw that year, along with the fact that the market was coming off a major "oversold" condition following the credit crash. Between 2010 and 2011 the 6-year cycle was peaking, which helped the market maintain is upward trend in those year. History has shown that Federal Reserve interventions are most effective when a major yearly cycle has either just bottomed and has freshly turned up, or else when a major cycle is in its "hard up" phase prior to peaking. In years when the broad market trend was down, or when no major cycle was peaking, Fed interventions aren't as effective.
The last of the major yearly cycles to peak occurred just over two months ago with the peaking of the 4-year cycle. Moreover, according to the late Bud Kress of SineScope, a major quarterly cycle is scheduled to peak in late March/early April next year. This is what Kress referred to as the "Catastrophic Cycle" in his writings. He referenced it as potentially beginning "a 1 ½-year sustained decline a la 1973-74 tantamount to death by a thousand cuts." He added that this will happen for "the first time since the beginning of the 120-year Mega Revolutionary cycle which heralded the beginning of the Industrial Revolution in the mid 1890s."
In one of his final SineScope missives before his passing, Mr. Kress also made the following observation worth mentioning: "The fourth and final 30-year mini economic super cycle peaked at the 1999/2000 turn of the century. It produced an all-time high in the S&P of 1,535 which began a 15 year secular bear market scheduled to end with the bottom of the 120-year Mega Cycle in the fourth quarter of 2014. Halfway in 2007, the S&P achieved an effective double top at 1,565 which began the secular bear market decline which has yet to be equaled."
Kress emphasized that the years 2013 and 2014 should prove to be economically disappointing ones. He pointed out that even with the Fed's constant intervention in recent years the economy has barely nudged forward since the credit crisis. Despite record outpourings of liquidity the economy has basically been treading water for the last four years. Does this not speak to the massive undercurrents of long wave deflation that are currently in force?
Indeed, the Fed's notable failure to reverse the economic tide provides strong circumstantial evidence that the long-term deflationary cycle Kress wrote about for many years is a reality.
2014: America's Date With Destiny
Take a journey into the future with me as we discover what the future may unfold in the fateful period leading up to - and following - the 120-year cycle bottom in late 2014.
Picking up where I left off in my previous work, The Stock Market Cycles, I expand on the Kress cycle narrative and explain how the 120-year Mega cycle influences the market, the economy and other aspects of American life and culture. My latest book, 2014: America's Date With Destiny, examines the most vital issues facing America and the global economy in the 2-3 years ahead.
The new book explains that the credit crisis of 2008 was merely the prelude in an intensifying global credit storm. If the basis for my prediction continue true to form - namely the long-term Kress cycles - the worst part of the crisis lies ahead in the years 2013-2014. The book is now available for sale at: http://www.clifdroke.com/books/destiny.html
Order today to receive your autographed copy and a FREE 1-month trial subscription to the Gold & Silver Stock Report newsletter. Published twice each week, the newsletter uses the method described in this book for making profitable trades among the actively traded gold mining shares.
By Clif Droke
www.clifdroke.com
Clif Droke is the editor of the daily Gold & Silver Stock Report. Published daily since 2002, the report provides forecasts and analysis of the leading gold, silver, uranium and energy stocks from a short-term technical standpoint. He is also the author of numerous books, including 'How to Read Chart Patterns for Greater Profits.' For more information visit www.clifdroke.com
Clif Droke Archive |
© 2005-2022 http://www.MarketOracle.co.uk - The Market Oracle is a FREE Daily Financial Markets Analysis & Forecasting online publication.