


BHP And RIO – Are Stocks Different From Futures? No
Companies / Company Chart Analysis Feb 28, 2013 - 12:26 PM GMTBy: Michael_Noonan

 We asked a metals specialist to select two stocks of interest. BHP and RIO were the choices. Are stocks any different from futures? Absolutely not. Why not? All markets are a function of supply and demand. When demand is greater, price will rise; when supply is greater, price will decline. It is the essence for any market, stocks or futures.
As a norm, we do not analyze stocks. In fact, we know nothing about BHP and RIO, beyond assuming they are mining stocks. Our premise is, when you reduce any market to price and volume, you get the most accurate information available in order to make buy/sell decisions, regardless of whatever is being analyzed.
Most tend to view fundamentals as a true measure for future price prospects. Many use technical analysis to interpret, even "predict" where price is likely to go. We use charts, a form of technical analysis, but not in the traditional sense. The most important elements for understanding the markets comes from reading the price and volume relationships in developing market activity. There is no need for artificial tools like RSI, moving averages, Stochastics, MACD, etc, etc. These are all mechanical measures, using past tense activity imposed upon present tense prices to somehow "understand" future development. We view them akin to a stopped clock that works with precision, twice a day. Not so much for most of the other times.
When those with access to the most information, with the smartest analysts, and the greatest amount money to spend for research, the controlling influences behind a market, decide to use that information by placing orders buy or sell, all decisions are translated into price and volume, and they immediately become a permanent record, along with all other buys and sells that comprise the overall market.
What we will call smart money cannot totally hide what they are doing because activity can be tracked by reading the interaction between price and volume. All controlling sources require volume to execute their trades. Great effort is made to "disguise" their hand, but they are unable to hide from the volume trails left behind. We may not be privy to those who make all the important decisions, but we get a proxy "view," as it were, by looking over their shoulder as they execute in the marketplace.
If one knows what smart money is doing, one need not know anything else about what is being traded. We put that hypothesis to the test with BHP and RIO.
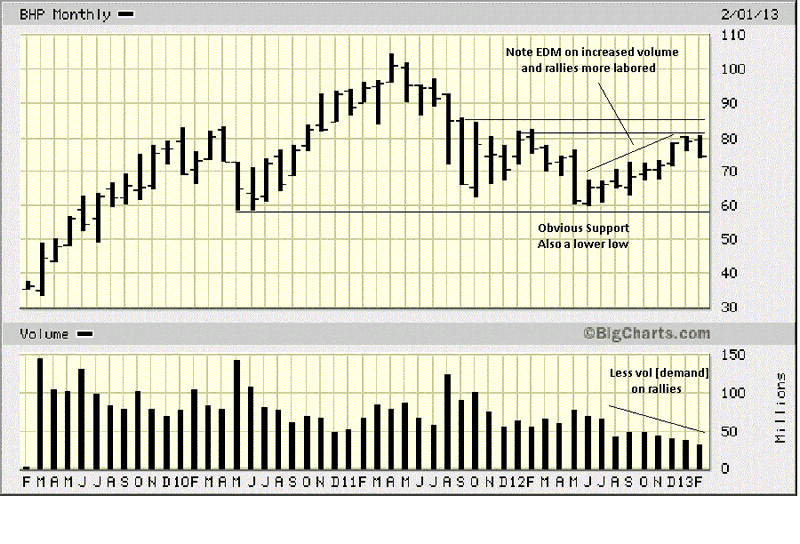
Higher monthly time frames are used to put a market into a context. It reveals the trend, if any, and important areas of successful or failed activity that may impel or hinder present tense developing market activity. The information gleaned is strictly what the market is saying about the collective participants.
What immediately stands out on the monthly is a lack of a defined trend. A closer look at bar activity since the small range 2011 high shows how price moves down easier than up. The wider range bars occur when price moves lower showing [EDM], Ease of Downward Movement.
Compare the single down bar in May 2012 and how it took seven months to retrace that one month. The rally from that low has been labored, which is what the market is saying.
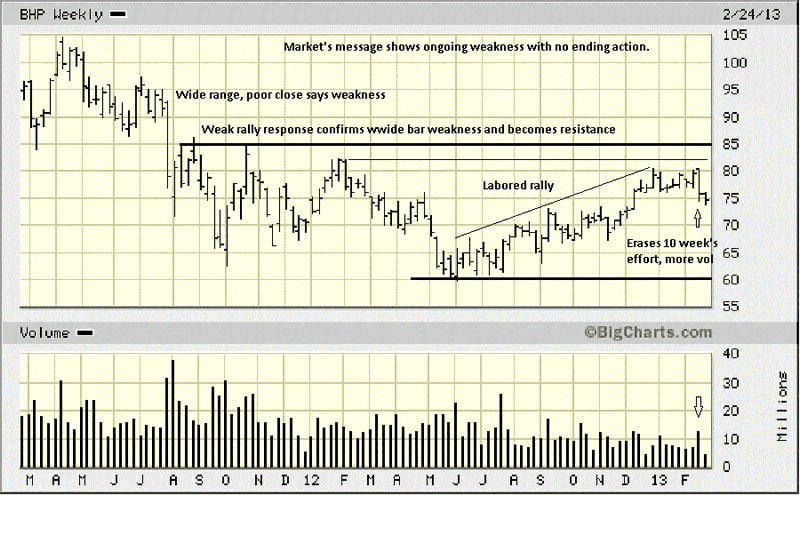
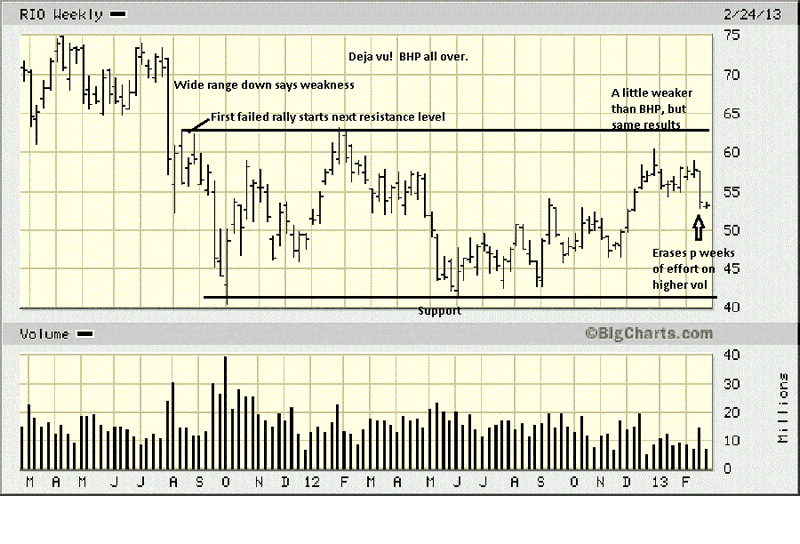
The weekly provides greater detail. August of 2011 is when price really accelerated to the downside, a definite sign of weakness. Be aware that most of what we say is based upon factual and indisputable market data, and from these observable facts, inferences can be drawn.
Volume increased sharply on the decline. Pay close attention to exceptionally high levels of volume because it is generated by controlling influences, what we call "smart money." Mention was made that smart money cannot always hide its hand because it needs to transact so many shares. In this instance, smart money was bailing.
This is confirmed just three weeks later when a retest rally fails to go any higher, and that sets an area of resistance moving forward. We use that failed level to draw a horizontal line in order to observe how price reacts to it in the future.
In January 2012, the rally stops just short of the upper resistance line, that inability an indication of more weakness, and another horizontal line is extended into the future from that lower high to observe future price behavior as it approaches this lower resistance area.
From the 2012 mid-year low at 60, we see a labored rally back to the lower of the two failed price areas, and BHP cannot even reach the highs of the second area, again. The market is telling us to expect more weakness. That observation is confirmed by a move sideways for seven weeks. In the 8th week, the market reinforces its message as price drops sharply, the EDM erasing the previous 10 week's effort to go higher.
Support comes in at the 60 area, but a look at the daily says some potential support exists a little higher.
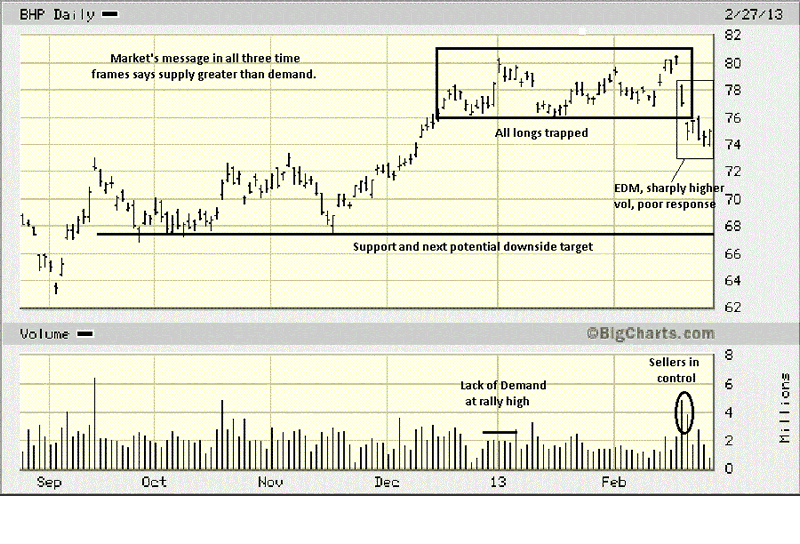
The daily is an example of why you should always start with higher time frames. Taken by itself, it could be said the daily has been in an uptrend until January 2013. An awareness of the higher time frames is so important, for this reason.
The 10 week sideways activity failed at an obvious resistance area a fact known from the weekly and monthly charts that is not apparent on the daily. One thing known about smart money participants is, they sell high, buy low. Would you imagine smart money was actively buying just below resistance? More than likely, the public were accumulating long positions, and now, they are trapped.
The small range at the 80 plus high, seven bars ago, just under known resistance, was a huge red flag. Small ranges at highs is the market letting us know that demand just is not there. If you did not sell by the end of the day, BHP was a definite sell on the opening, next day.
There has been a small measure of support around 74 -75, but when you compare it to the decline from 80, this has been a very weak response, at best, and more weakness is likely to follow. A look at Wednesday's intra day activity, 27 February, when this was written, shows immediate resistance at 76 and 78. How price responds to these areas will provide yet more information about what to expect, moving forward.
Again, all of the information gathered is coming from the market. We do not even have to know if this is BHP, AAPL, or corn futures. All markets are a function of supply and demand.
There are obvious similarities between BHP and RIO. The resistance formed in April 2010 became support, once price rallied above it in October. This is pointed out because that price level was where support broke down dramatically, at "A," and persists as resistance to this day. The market's present is almost always related to its past, in some way, and those Remembrances of Things Past, [Marcel Proust], is the market's way of offering important guidance for making decisions.
The failed probe higher in January 2012 confirmed the importance of the 61+ area as resistance. The wide range EDM decline in May 2012 is the market telling us sellers are in total control. This, too, was confirmed by the labored rally over the next 8 months to retrace what was lost in just one month.
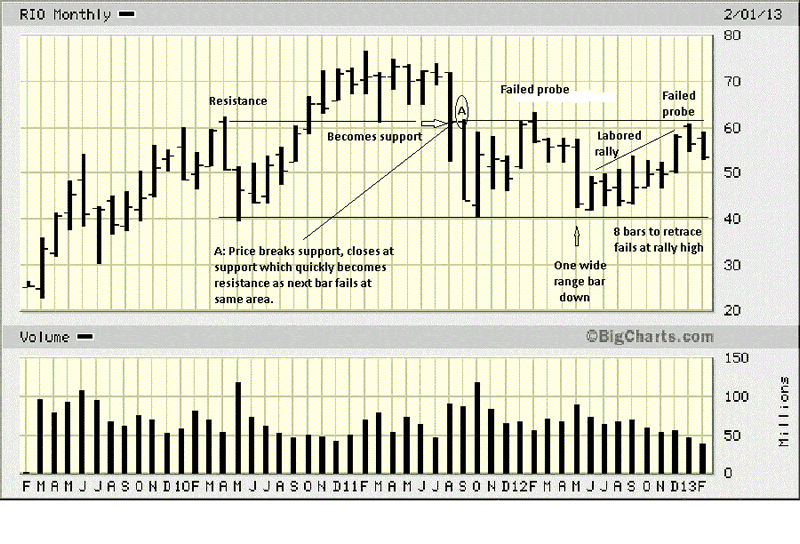
We thought we had downloaded BHP by mistake, the charts look so similar. Comments on the chart pretty much tell what is needed in order to know if one should be a buyer or a seller, all based on feedback from market activity.
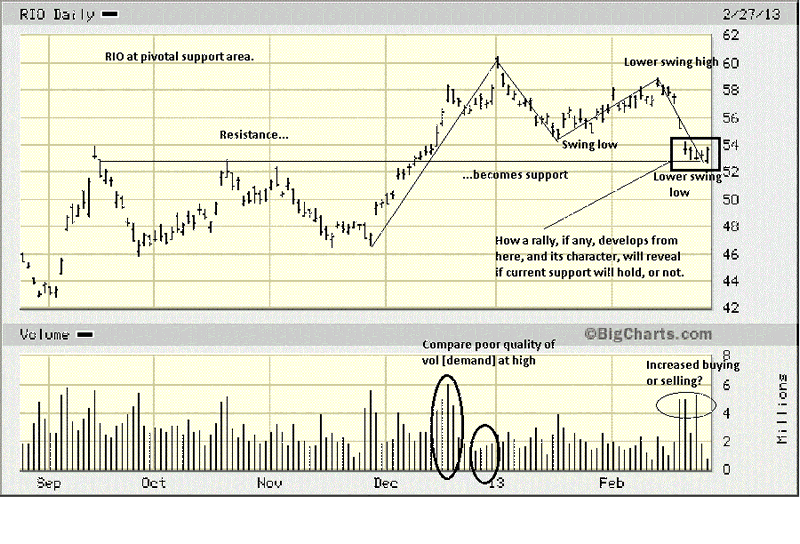
The zig-zag lines from the November low connect swing highs and swing lows. The easiest definition of a trend down is lower swing lows and lower swing highs. The daily just made a lower swing low, and the fact that price has not rallied away from support is telling us RIO continues to be weak.
The sharply increased volume in February, the highest since December, occurred as price declined, the market's way of letting us know that sellers remain in control. 55 is immediate resistance on the daily, if RIO can rally, and even stronger resistance is at 56 - 57. If 52 - 53 fails to hold, price can decline back to the weekly TR low, the 41 area.
The market offers the best and most reliable information. One can be oblivious to the fundamentals, as we are, and still be able to operate quite well in knowing when to buy or sell.
As an aside, some see metals stocks as an alternative for owning the underlying metals. They are not. Each should be treated separately, based upon individual developing market activity.
By Michael Noonan
Michael Noonan, mn@edgetraderplus.com, is a Chicago-based trader with over 30 years in the business. His sole approach to analysis is derived from developing market pattern behavior, found in the form of Price, Volume, and Time, and it is generated from the best source possible, the market itself.
© 2013 Copyright Michael Noonan - All Rights Reserved Disclaimer: The above is a matter of opinion provided for general information purposes only and is not intended as investment advice. Information and analysis above are derived from sources and utilising methods believed to be reliable, but we cannot accept responsibility for any losses you may incur as a result of this analysis. Individuals should consult with their personal financial advisors.
Michael Noonan Archive |
© 2005-2022 http://www.MarketOracle.co.uk - The Market Oracle is a FREE Daily Financial Markets Analysis & Forecasting online publication.