


Silver Game Changer - Institutional Buying
Commodities / Gold and Silver 2014 Jan 21, 2014 - 10:52 AM GMTBy: Steve_St_Angelo

 The key to investing in silver is getting in before the big gains are made. Even though the price of silver is up substantially in the past decade, it has only kept in par with the rise of the cost of energy.
In 2004 the price of a barrel of Brent crude was $38 and silver was $6.67. Today the price of silver is $20.50 and Brent crude trading at an average $110 for the past month. Basically, the price of both have tripled in the past decade:
Brent Crude = $38 X (3) = $114
Silver = $6.67 X (3) = $20.01
The market price of silver is keeping pace with the percentage increase in the price of oil. This seems to be how the market is currently pricing silver.. same with copper. The price of copper was $1.25 lb in 2004 and in 2013 it averaged $3.30 lb.
Copper = $1.25 lb X (3)= $3.75
Of course there are many additional factors that go into pricing a commodity, however we can see that the price of energy is good indicator in finding a base guideline.
This should give the silver investor some reassurance that the average price of silver will not fall much in percentage terms below its present level. I say average because short-term movements in price can be highly volatile. A perfect example of this is the price of Brent Crude:
Brent crude had a big price spike to $132 in July 2008 and then a huge decline to $40 in Dec... just five months later. Although the short-term fluctuations in price have been quite volatile, the average trend has been steadily higher.
Analysts who are forecasting a deflationary collapse in the price of oil, fail to understand the market today needs a much higher price than it did just 3-5 years ago. If the price of U.S. West Texas Intermediate oil were to fall below $70-80 and remain at that level... well that means you can kiss goodbye the supposed "Shale Oil Revolution."
Martin Armstrong recently wrote a blog entry titled, "Dollar Bears May Get Slaughtered" in which he wrote the following comments:
It has been American technology that has also changed the game in energy. The dollar bears just refuse to believe anything has changed. The American oil boom is real and nothing is more self-evident that the sheer fact that 15 major European refineries have been driven out of business in the past 5 years because the US no longer is importing oil from Europe.
Currently, domestic drillers are starting to even threaten change the whole dynamics of energy on the West Coast eliminating the producers in the Middle East and South America. The cheap oil coming out of the Rocky Mountains, has seen output surge by 31% since 2011.
This bullish trend for the dollar that is on the horizon may be sparked by the political trends, but it is far more fundamental. It is reflected in all commodities from gold to wheat.
Armstrong touts "American Invention" for the recent great boom in domestic oil production. That's total rubbish. Hydraulic fracking was invented more than half of a century ago.
The first experimental use of hydraulic fracturing was in 1947, and the first commercially successful applications were in 1949. George P. Mitchell is considered by some the modern "father of fracking" because he successfully applied it to the Barnett Shale in the 1990s.
Horizontal drilling and Hydraulic fracking have been around for decades. The technology is old as dirt. The only reason why we are producing a great deal more oil in the U.S. presently is due to the HIGHER PRICE... not the technology.
I would like to take this time to kindly remind the reader that:
TECHNOLOGY COSTS A LOT OF FIAT CURRENCY
Who on earth would spend $80-$90 a barrel on advanced oil drilling technology if the market was only paying $50-$70?? Maybe Chesapeake, as they are still losing their shirts producing natural gas at $4.
Armstrong goes on further to say that this new energy revolution in the U.S. will be bullish for the Dollar, thus bad news for the Dollar Bears. Armstrong believes in this market strategy because he has fallen victim to the shale energy propaganda.
While shale energy in the states has bought some time for the U.S. Dollar... it won't last long.
Putting the Comex Silver Inventories Into Perspective
Silver investors today have this notion that the build of inventories at the Comex to be a negative or bearish indicator for the price going forward. This may seem plausible at first glance, but when we look over the longer term, inventory builds or declines tend to have little impact on the price.
The chart below is a 5 year chart of total silver inventories at the Comex:
If we look at the chart we can see a build of 79 million oz from the low set in May, 2011. However, if we consider the net build since 2009, it has only been 40 million oz.
While the decline in total Comex silver inventories bottomed at the same time the price of silver peaked (May 2011), looking at past data, we find no real correlation between price and warehouse stocks.
This next chart shows the Comex Silver Inventories from 1993-2005. Inventories declined from 270 million oz in 1993 to 50 million oz by 1999.
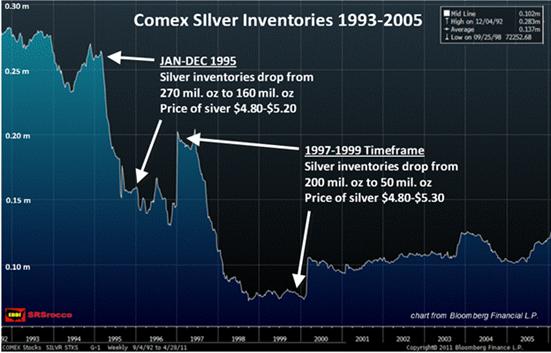
In seven years the Comex silver inventories declined 220 million oz (81%). So what was the impact on the price?
1993 Comex = 270 million oz / Average Silver price = $4.97
1999 Comex = 50 million oz / Average Silver price = $5.22
After the Comex lost 81% of its silver inventories, the net change in the price of silver was a whopping $0.25 or 5%.
The very next chart provides additional proof that warehouse stock movements have no bearing on the price of silver.
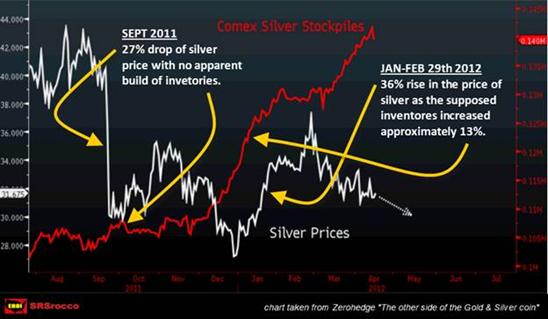
First, in Sept. 2011, the price of silver fell an amazing 27% with no apparent build of inventories. Second, from Jan-Mar 2012, Comex silver warehouse stocks increased 15 million oz while the price of silver rose from $28 to $38.
Lastly, the future value of silver will be determined by the size of institutional and retail investor demand and not by warehouse stock levels at the Comex.
Gosh... What About Silver Industrial Demand & Price?
Another concern silver investors have is a fall of industrial demand. While silver is an industrial metal, its price appreciation over the past decade had more to do with rising energy costs & investment demand rather than industrial consumption.
The chart below shows the 7-year trend of industrial silver consumption:
In 2007, silver industrial consumption was 486 metric tons (mt) while the price averaged $13.38. Then in 2011, industrial consumption increased a paltry 2 mt as the price jumped 162% to $35.12.
If we look across the chart (except for 2009), annual silver industrial consumption ranged from 470-490 mt with a linear trend of 475 mt for the overall period.
So, if industrial demand was basically flat over the past 7 years, why did the price of silver move up so much? Simple (as I have stated time and time again)... it was due to investment demand.
Global silver investment demand increased from a measly 4o million oz in 2007 to over 250 million oz in 2010. Thus, it had a dramatic impact on the price of silver.
Silver investors who want to know where the price of silver is headed in the future need to be concerned more with investment demand rather than industrial consumption.
INSTITUTIONAL BUYING: The Silver Game Changer
The sector that will have the largest impact on future silver investment demand will be institutional buying. According to Rick Rule of Sprott Asset Management, we may be witnessing the beginning stages of what could be a big move of institutional investors in the physical precious metal market.
Rick Rule Interviewed on King World News, stated there has been big money circling the natural resource sector and now it looks like a portion is finally making its way into the market. Recently, Sprott Asset Management won two very large mandates.
1) $100 million from Chinese Zijin mining to partnership with Sprott Asset Management with another commitment of $300-$400 million for future investment.
2) Sprott to co-manage $750 million South Korean private equity fund.
Rick also believes the precious metals offer a much better investment potential for institutions because gold and silver are presently undervalued compared to its overvalued competition -- U.S. Treasuries and Long Sovereign Bonds.
Furthermore, Rick speculated on how big money could impact the silver market (paraphrasing):
If $2 billion went into the silver futures market and called for delivery, the relatively low inventory in warehouse stocks could take these markets to a cash basis and really drive the price higher.
There is very little participation on the long side while there is a great deal on the short side So, it wouldn't take much to give the shorts a truly religious experience.
Finally, Rick went on to say that Sprott Asset Management believes there will be increased institutional sovereign participation in the physical and certificated physical precious metal markets. Certificated physical funds are those such as the Sprott PSLV which guarantees the investor an exchange of shares for physical silver metal.
The writing is on the wall. The Fed & Western Central Banks are propping up the world financial markets by pumping in huge amounts of liquidity. This policy has put into question the long-term viability of the Treasury & Bond markets.
Even though the East is participating in the Grand Paper Liquidity Scheme, they are forced to do so because the Dollar is still the global reserve currency. However, as confidence in the Treasury & Bond markets begin to wane, we are going to see more institutions and retail investors rotate out of paper and into physical assets.
This is clearly shown by the huge increase of physical silver demand by India in 2013:
Due to the government regulating the flow of gold into the country in 2013, Indian investors switched to purchasing silver which drove imports to a record high. Indian silver imports are forecasted to reach 5,400 metric tons (mt) in 2013 up from 1,900 mt in 2012.
If we consider the 2,457 mt build of Comex silver inventories since 2011, it averages about 1,000 mt increase per year. It wouldn't take much in the way of institutional buying to absorb that extra 1,000 mt.
In conclusion, I have to get a laugh at the brokerage houses who continue to put out the typical supply and demand forecasts for silver as the world financial system heads closer towards a systematic collapse.
Retail investors today are worried that the paper price of silver could fall even lower in 2014. While this may be true, how many Americans have been throwing their hard-earned fiat currency into 401K's for the past 20-30 years? Who cares where the price of silver trades in the next few years if the best fundamental strategy is for long-term investing.
I'd rather lose a few bucks if the price of silver fell in the short-term rather than watch hundreds of thousands of Dollars evaporate in a 401K when the greatest paper Ponzi scheme in history implodes.
 At the SRSrocco Report, we will discuss how energy will impact the precious metals, mining and overall economy. Next month I will be adding a REPORTS PAGE to the site that will have FREE & PAID Reports. The first paid report will be the U.S. & Global Collapse Report. I will be including information in the report that you will not find anywhere else on the Internet.
The coming collapse of the U.S. and Global Economy will be like nothing many are forecasting. If you want to find out more... check back at the SRSrocco Report for the release of the U.S. & Global Collapse Report.
© 2014 Copyright Steve St .Angelo - All Rights Reserved Disclaimer: The above is a matter of opinion provided for general information purposes only and is not intended as investment advice. Information and analysis above are derived from sources and utilising methods believed to be reliable, but we cannot accept responsibility for any losses you may incur as a result of this analysis. Individuals should consult with their personal financial advisors.
© 2005-2022 http://www.MarketOracle.co.uk - The Market Oracle is a FREE Daily Financial Markets Analysis & Forecasting online publication.