


Gold Price Decisive Breakout, Precious Metals Major Uptrend
Commodities / Gold and Silver 2014 Feb 17, 2014 - 03:29 AM GMTBy: Clive_Maund

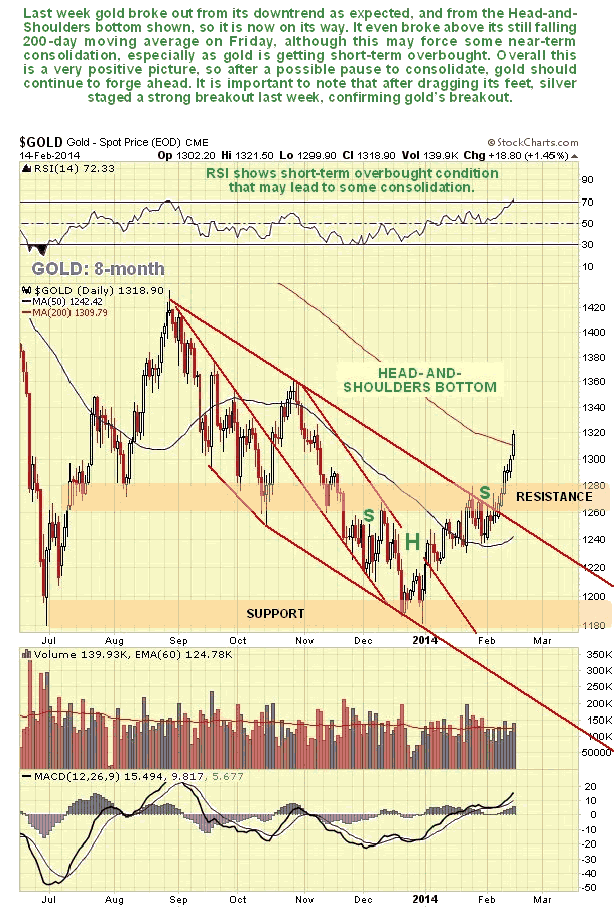
 Gold broke out decisively last week from its downtrend dating back to last August, a development that was confirmed by a dramatic high volume breakout by silver on Friday.
On its 8-month chart we can see that gold broke out both from its downtrend and also from a Head-and-Shoulders bottom. It even managed to close above its 200-day moving average on Friday, although the fact that this average is still falling coupled with an overbought reading on its RSI indicator may lead to gold consolidating a little before it makes further gains. Overall though this is a very positive picture, with a clear breakout, and a now rising 50-day moving average that will lead to a bullish moving average cross if gold can hold its gains made so far or if it advances further.
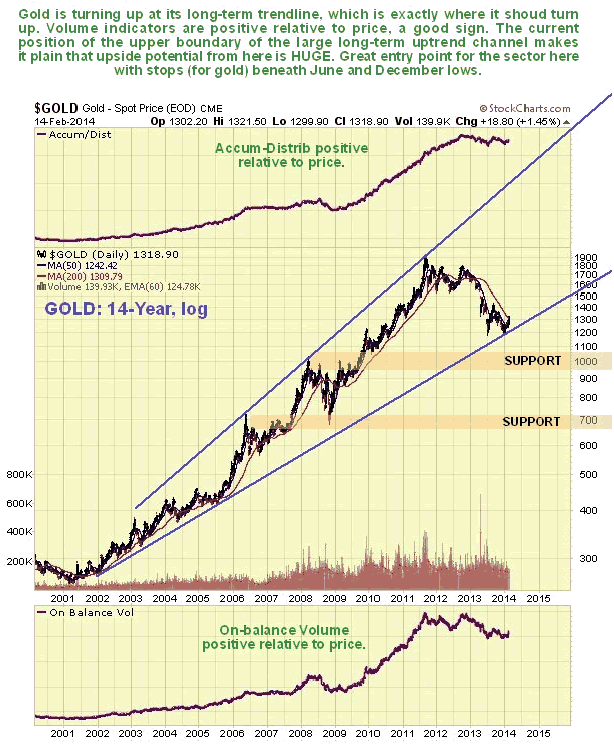
The 14-year log chart for gold makes it clear why gold has turned up here - it has found support and reversed exactly at its major long-term uptrend line. On this chart gold's decline from its 2011 highs looks like a normal correction, if rather long and deep. The most encouraging thing about this chart for bulls is that it shows gold's massive upside potential from here, for if gold should succeed in bettering its highs and continues towards the upper boundary of its major long-term uptrend, it will result in it rising to the $3000 - $4000, which is not unreasonable considering what is being done to the world's major currencies, and specifically to the dollar.
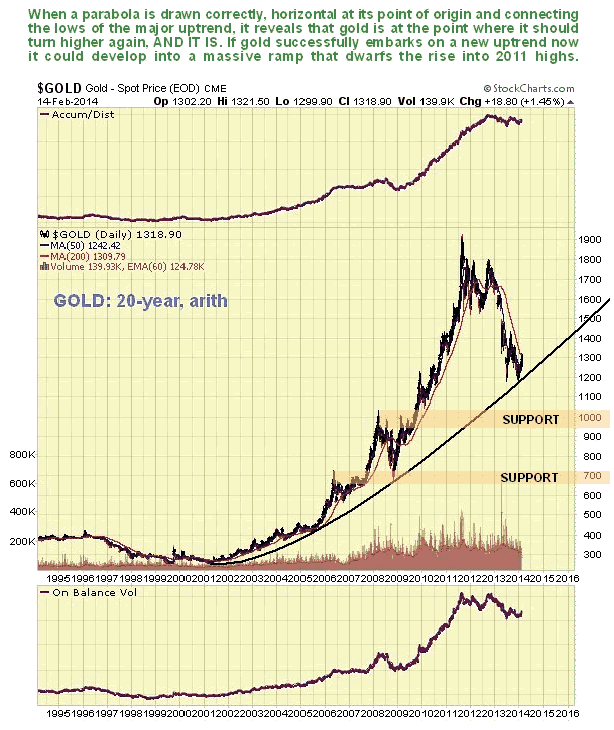
The 20-year arithmetic chart also presents a fascinating picture as it shows gold reversing to the upside from its long-term parabolic uptrend, which most importantly has not failed to date, and which projects a gold moonshot, if it can stay above the parabola and break above earlier highs.
Gold firming up kind of implies that the outlook for the dollar is not too bright, so let's look at the dollar chart now in an effort to figure out the outlook for this crucial determinant of the gold price.
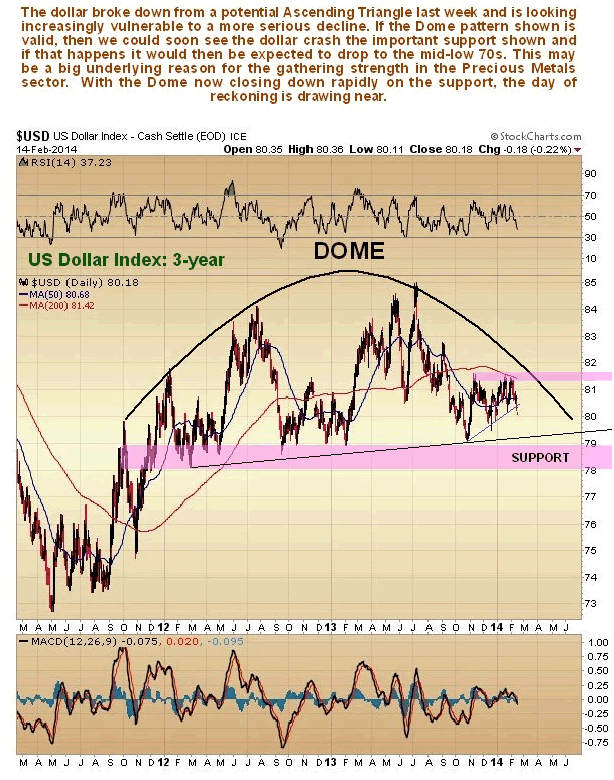
On its 3-year chart we can see that the outlook for the dollar index looks increasingly grim. The potential Ascending Triangle in the dollar failed last week, with it breaking below an important uptrend line better seen on short-term charts, and this was doubtless a factor playing an important part in gold and silver breaking out. Gold and silver appear to be "scenting blood" with respect to the dollar and may be anticipating the Distribution Dome shown on our chart pressing down on the dollar to the extent that it crashes the important support also shown, leading to its dropping back to the next important support level in the 73 - 74 area. This would be a big drop by the dollar that would have serious global ramifications.
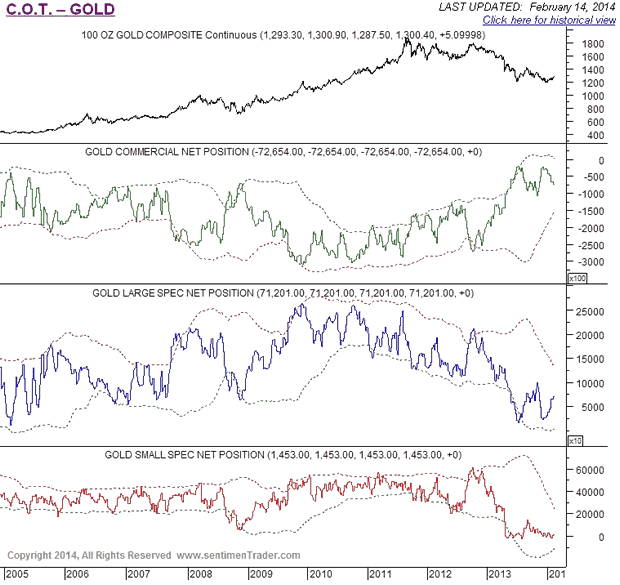
The latest COT charts for gold continue to show a bullish setup, with the Commercials still having a historically low short position, the Large Specs a low long position, and the Small Specs are out, having been destroyed by the long reaction from 2011 (the Large Specs are able to bounce back more easily, because it's usually other peoples' money that they are losing).
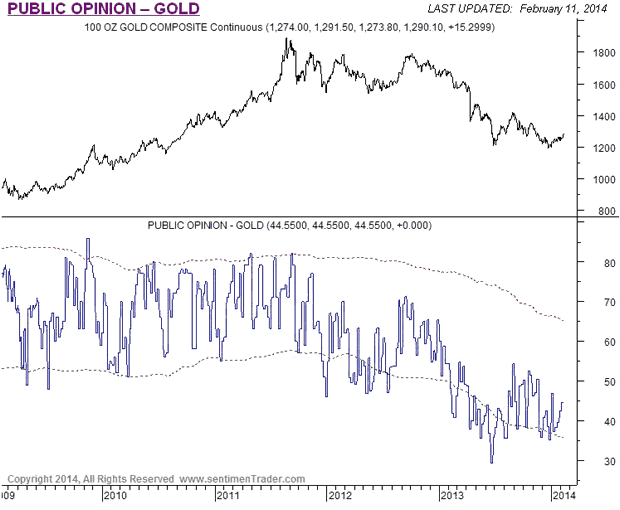
Public Opinion on gold is starting to pick up from a low level, but it is still at a fairly low level, so gold has a long way to go before interest in it rises to levels that would cause concern.
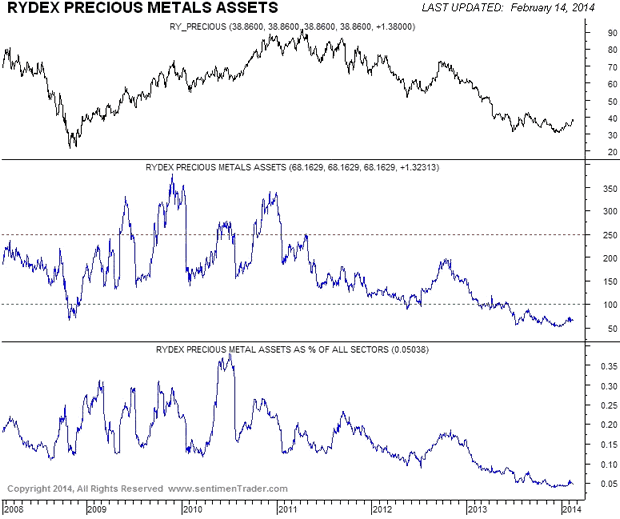
Those indefatigable contrarian indicators, the Rydex traders, still have a very low stake in the Precious Metals sector, which is of course very bullish. When their holdings reach high levels it's time to start looking for the exits, and we are clearly a long, long way from that situation.
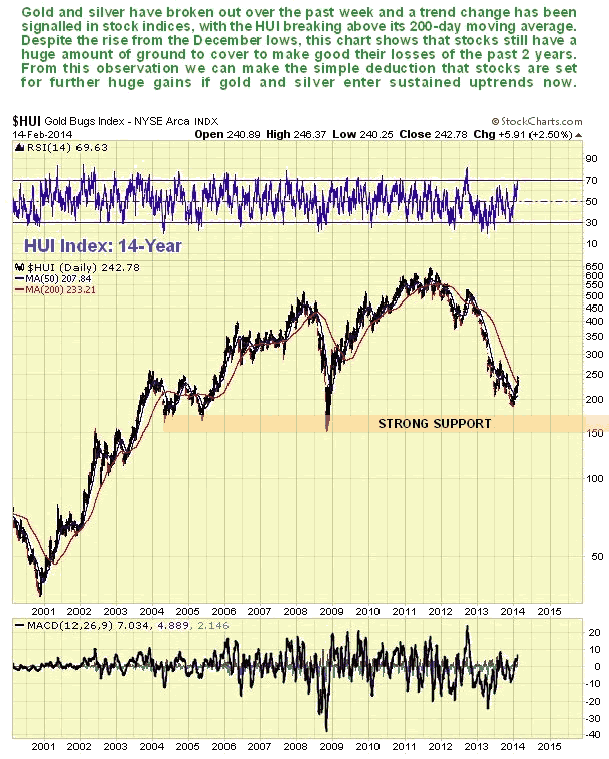
The latest long-term 14-year chart for the HUI index looks good, with it turning up and breaking above its 200-day moving average. This is a valuable chart because it shows us that PM stocks still have a huge amount of ground to make up to make good the losses of the past couple of years, and with gold and silver now embarking on what should prove to be significant uptrends, that is precisely what stocks look set to do, and it also follows that should gold and silver eventually go on to break out to new highs and continue upwards to the tops of their respective major uptrend channels, then stocks indices too should break out to new highs, which would be a development that could lead to spectacular gains.
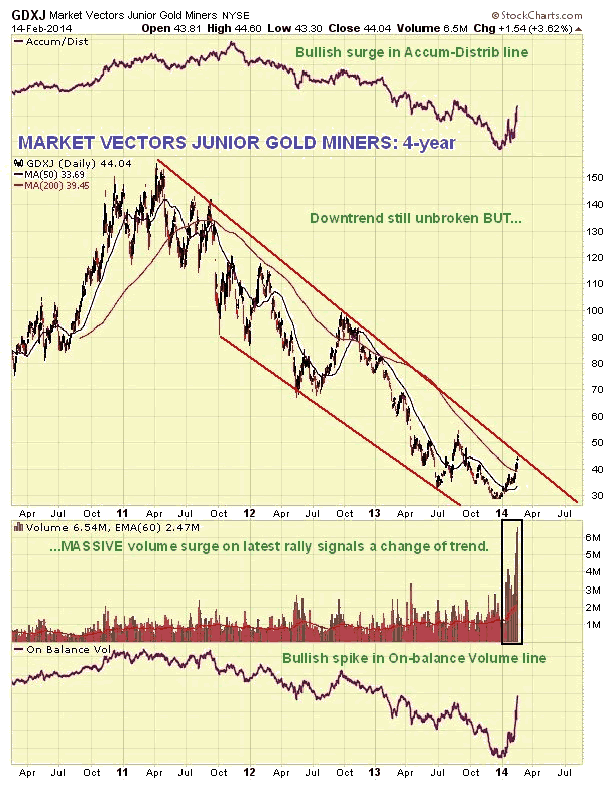
The 5-year chart for the Market Vectors Junior Gold Miners ETF, code GDXJ, is most interesting. To the casual observer it looks like this is vulnerable to immediate reversal and decline, as it has just arrived at the top of its major downtrend channel, but the volume pattern is telling a very different story. Volume on the rally out of the December lows was HUGE, at record levels, and it was even greater on the 2nd upleg this month, and it has driven volume indicators sharply higher. This huge record upside volume is a clear sign that a trend change is underway, and thus that breakout from the downtrend is to be expected soon. We would therefore not expect to see anything more than a minor reaction back from this downtrend line - if that.
The conclusion to all this is that a major Precious Metals sector uptrend began last week, and that this is the time to buy right across the sector, if you not already done so. This buying may include gold itself, gold ETFs, and a wide range of better gold stocks from large caps through mid-caps to juniors, but taking care to avoid the stocks of dodgy companies with huge debts and/or excessive number of shares in issue - common sense is what counts here. Speculators may want to leverage gains by means of Call options.
We will continue to highlight the better ETFs and stocks on the site going forward.
By Clive Maund
CliveMaund.com
For billing & subscription questions: subscriptions@clivemaund.com
© 2013 Clive Maund - The above represents the opinion and analysis of Mr. Maund, based on data available to him, at the time of writing. Mr. Maunds opinions are his own, and are not a recommendation or an offer to buy or sell securities. No responsibility can be accepted for losses that may result as a consequence of trading on the basis of this analysis.
Mr. Maund is an independent analyst who receives no compensation of any kind from any groups, individuals or corporations mentioned in his reports. As trading and investing in any financial markets may involve serious risk of loss, Mr. Maund recommends that you consult with a qualified investment advisor, one licensed by appropriate regulatory agencies in your legal jurisdiction and do your own due diligence and research when making any kind of a transaction with financial ramifications.
Clive Maund Archive |
© 2005-2022 http://www.MarketOracle.co.uk - The Market Oracle is a FREE Daily Financial Markets Analysis & Forecasting online publication.