


Stocks Bull Market Continues
Commodities / Gold and Silver 2014 Feb 22, 2014 - 09:58 PM GMTBy: Tony_Caldaro

 Even though it was a holiday shortened week the market finished a rally on Wednesday at SPX 1848, dipped to 1825 by Thursday, then started another rally. For the week the SPX/DOW were -0.20%, the NDX/NAZ were mixed, and the DJ World index was +0.60%. Economic reports came in slightly lower for the third week in a row. On the uptick: the CPI/PPI, leading indicators, the monetary base, plus weekly jobless claims improved. On the downtick: the NY/Philly FED, the NAHB index, housing starts, building permits, existing home sales and the WLEI. Next week we get Q4 GDP, Durable goods orders and more Housing reports.
LONG TERM: bull market
During the week we did an historical trend for trend study of the SPX/DOW/NAZ from 1982 to the present. We excluded the 1990-2000 period, because of the complexity of the advance, and the NDX since it only started trading in the early 1990′s. The historical period included four bull markets: 1982-1983, 1984-1987, 1987-1990 and 2002-2007. After this wave for wave study we arrived at two basic conclusions: one we already knew and one we did not.
The SPX/DOW bull markets unfold, for the most part, in unison with each other. The NAZ/NDX bull markets unfold in their own individual pattern. This is the new observation. As a result of this analysis we are quite convinced the current wave labeling on the SPX/DOW is correct. After a review of the current bull market in the NAZ/NDX we upgraded the NAZ charts to the count we were carrying as an alternate on the NDX charts. We feel quite confident they both present the correct current count. So what does this mean?
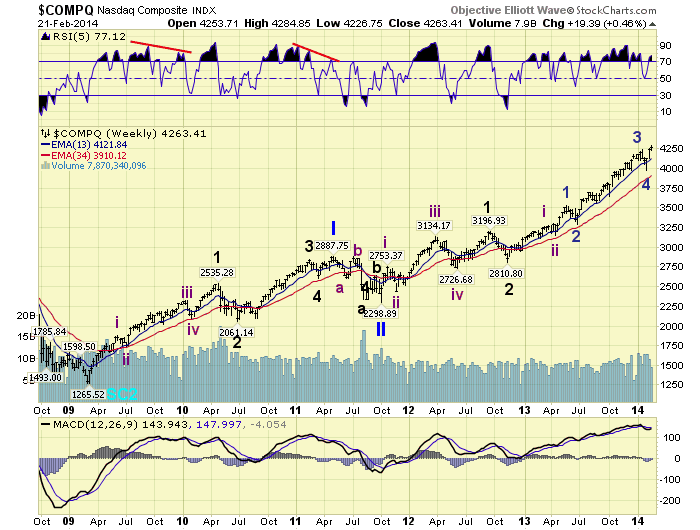
The NAZ/NDX count suggests the growth indices are currently nearing the end of Intermediate iii, of Major 3, of Primary wave III. They are nowhere near completing Primary III. Before Primary III completes in these indices, they must first complete the current uptrend to end Int. iii. Then downtrend for Int. iv, uptrend to end Major 3, downtrend to end Major 4, then uptrend again to complete Primary III. This whole process could end as quickly as June, or could extend throughout most of 2014. So what does this mean for the SPX/DOW?
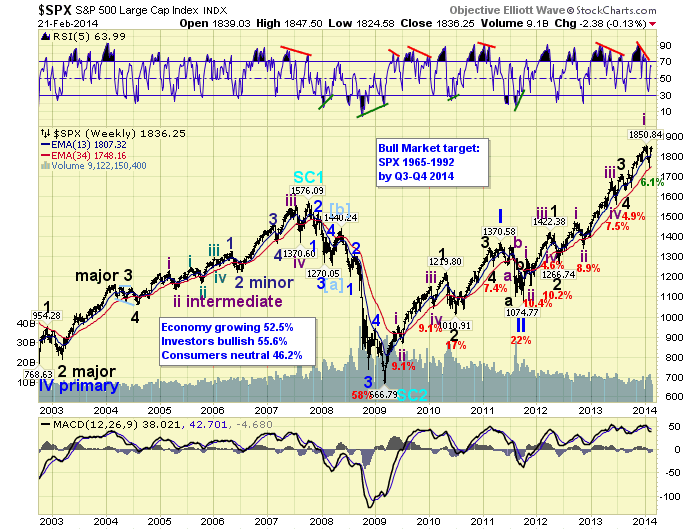
Since the NDX/NAZ are many months away from a Primary III high, the likelihood that the SPX/DOW are in Primary IV is probably only 20%. Since Primary II, in 2011, dropped about 20%, Primary IV should also drop around 15% to 20%. The likelihood of this occurring in the SPX/DOW without the NDX/NAZ is slim to none. The more likely count for the SPX/DOW, considering the NDX/NAZ still have two uptrends to complete after the current one, suggests the recent SPX 1851 high was Intermediate wave i of a subdividing Major wave 5. The recent low at SPX 1738 may have ended Intermediate wave ii, and the current rally is the beginning of Intermediate wave iii. There is also one slightly different count which we will cover later. In both scenarios, however, it would appear the Primary wave III high is still months away.
MEDIUM TERM: uptrend probable
After the SPX topped at 1851 in January, it declined in a very nice zigzag into a February 1738 low. The day of the low we expected a rally to follow into the SPX 1790′s. When it got there the market was beginning to look impulsive so we expected it to move higher to SPX 1814. When it reached SPX 1814 it continued to look impulsive, so we just went with the flow expecting a new uptrend. Initially we presented two potential B wave rally counts. This changed last weekend to an Int. ii low or a B wave rally. We are continuing with these two potential scenarios, but are downgrading the degree of the B wave from Major to Minor.
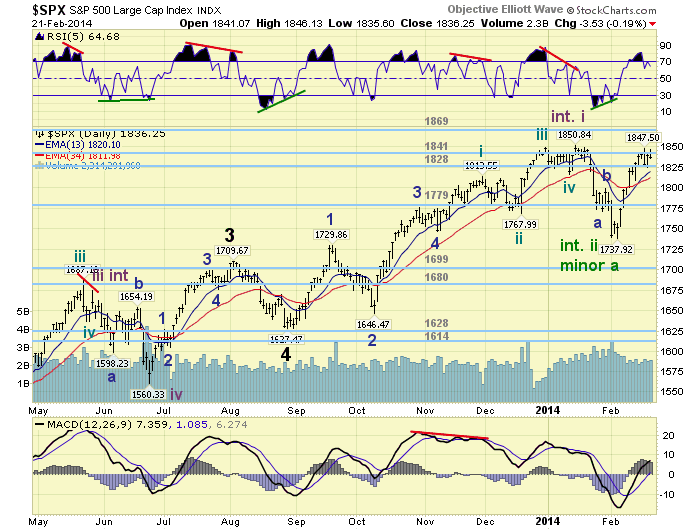
The two potential scenarios, currently preferred after the trend for trend analysis, are the following. Intermediate wave ii of Major 5 completed at SPX 1738, and Int. wave iii is underway. Intermediate wave ii of Major 5 is still underway, and the current rally is Minor wave b of an overall “a-b-c” Int. wave ii pattern. The reason this second count looks appealing is that the NDX/NAZ are currently out of sync, trend wise, with the SPX/DOW. And a somewhat complex Int. ii would synchronize them. Plus, the DOW has been lagging quite a bit during this rally. Naturally, the short term count, at some point, would have to start looking like a B wave. Which until this point it has not.
We rate both of these scenarios at 40% probability, and the Major wave B scenario at 20%. The charts have been upgraded to display the two preferred scenarios. Medium term support is now at the OEW 1828 and 1779 pivots, with resistance at the 1841 and 1869 pivots.
SHORT TERM
Short term support is at the 1828 pivot and SPX 1814, with resistance at the 1841 pivot and SPX 1851. Short term momentum declined to slightly oversold, after Friday’s oversold condition. The short term OEW charts remain positive with the reversal level now SPX 1835.
Thus far, from the SPX 1738 low, the market has impulsed higher: five waves up to SPX 1848: 1788-1777-1827-1809-1848. We then had a pullback this week to SPX 1825, and now a rally to 1846 and pullback to 1836. There are a few ways of counting this advance and this is the reason we have not posted any labels on it.
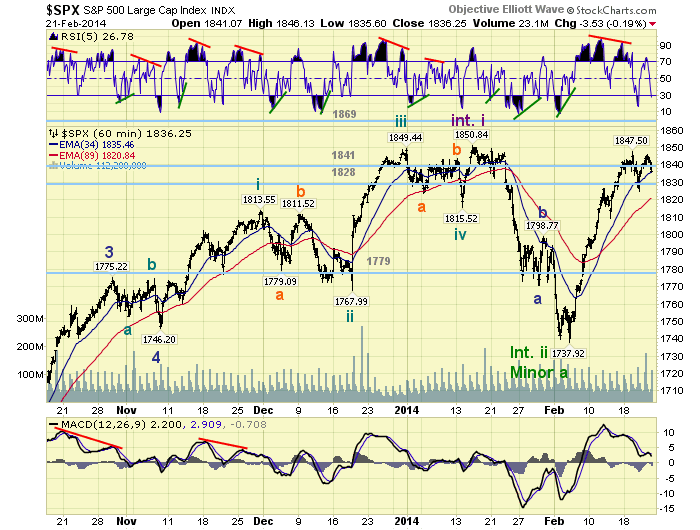
For the Intermediate wave ii scenario. We could count the 110 point rally, 1738-1848, as Minor 1. Then the pullback to 1825 as all/or part of Minor 2. Since the pullback was much shorter than expected for a Minor 2, the entire 110 point rally could also have been just Minute one of Minor 1. For the Minor wave B scenario. We could count the 110 point rally as wave a of an ongoing Minor B zigzag, and the decline to 1825 as wave b. This would make the current rally from that low wave c. As you can see there are a multitude of potential short term counts.
Overall, short term, we would not be surprised the see the SPX head back to 1825 or lower should it break the 7 point range of the 1841 pivot. If this occurred a Minor wave 2 low would fit much better than the current 1825 low. Should the market hold the 1841 pivot range, then we could count the advance from SPX 1825 as a 1-2: 1846-1836, with 3 to follow shortly. We are in the monitor and adjust mode short term. While in the project, monitor, and adjust if necessary medium and long term. Best to your trading!
FOREIGN MARKETS
The Asian markets were mostly higher on the week for a net gain of 1.8%.
The European markets were quite mixed and only gained 0.1%.
The Commodity equity group was mostly lower losing 1.2%.
The DJ World index gained 0.6%.
COMMODITIES
Bonds continue to uptrend but lost 0.1%.
Crude continues its uptrend and gained 1.8%.
Gold is also uptrending gaining 0.4%.
The USD remains in a downtrend but gained 0.2%.
NEXT WEEK
Tuesday: Case-Shiller, the FHFA index and Consumer confidence. Wednesday: New home sales. Thursday: weekly Jobless claims and Durable goods orders. Friday: Q4 GDP (est. +2.4%), the Chicago PMI, Consumer sentiment and Pending home sales. FED officials make three public appearances next week. Tuesday: Fed governor Tarullo gives a speech at 10am. Thursday: FED chair Yellen testifies before the Senate at 10am. Friday: FED governor Stein is in a panel discussion, also at 10am. Best to your weekend and week!
CHARTS: http://stockcharts.com/public/1269446/tenpp
http://caldaroew.spaces.live.com
After about 40 years of investing in the markets one learns that the markets are constantly changing, not only in price, but in what drives the markets. In the 1960s, the Nifty Fifty were the leaders of the stock market. In the 1970s, stock selection using Technical Analysis was important, as the market stayed with a trading range for the entire decade. In the 1980s, the market finally broke out of it doldrums, as the DOW broke through 1100 in 1982, and launched the greatest bull market on record.
Sharing is an important aspect of a life. Over 100 people have joined our group, from all walks of life, covering twenty three countries across the globe. It's been the most fun I have ever had in the market. Sharing uncommon knowledge, with investors. In hope of aiding them in finding their financial independence.
Copyright © 2014 Tony Caldaro - All Rights Reserved Disclaimer: The above is a matter of opinion provided for general information purposes only and is not intended as investment advice. Information and analysis above are derived from sources and utilising methods believed to be reliable, but we cannot accept responsibility for any losses you may incur as a result of this analysis. Individuals should consult with their personal financial advisors.
Tony Caldaro Archive |
© 2005-2022 http://www.MarketOracle.co.uk - The Market Oracle is a FREE Daily Financial Markets Analysis & Forecasting online publication.