


Gold Bear Markets
Commodities / Gold and Silver 2014 Apr 05, 2014 - 11:07 AM GMTBy: Jordan_Roy_Byrne

 It’s been a while since we looked at Gold in a vacuum. We’ve focused on the gold stocks as they have led the sector. We covered Silver last week. Gold is more interesting because in its current state its more difficult to draw a strong conclusion. One could look at the evidence and go either way. Today Gold is back above $1300. Is this the start of a run to and past $1400? I don’t know. My gut says more range bound activity is ahead.
First lets take a look at the Gold bear analog chart. This includes the major bears of the past 35 years, excluding a super long (1987-1993) bear that was very mild in its price decline. The Gold bear analog isn’t quite as black and white as the previous analogs shown for Silver and the gold stocks. One could look at this chart and surmise that the bear has longer to go while others could say it has gone far enough and deep enough already.
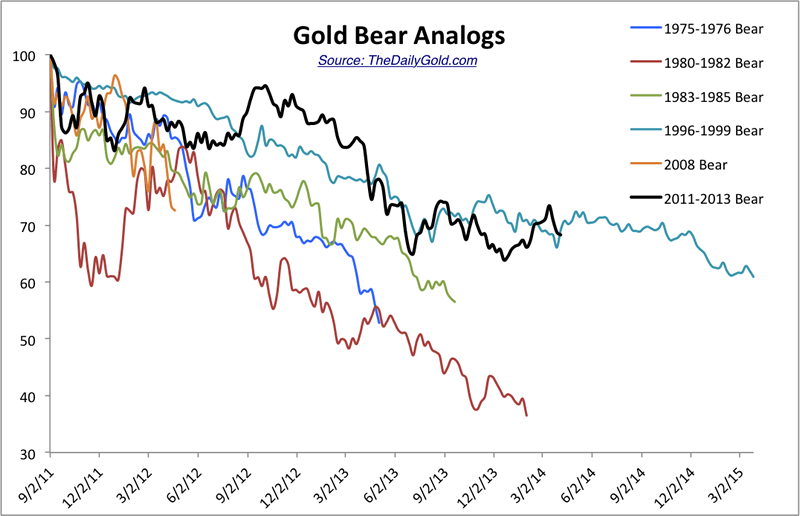
At the June 2013 and December 2013 lows, Gold was very close to plunging to that final low as it did in 1982 and particularly in 1976 and 1985. The fact that it didn’t happen and the fact that this bear has dragged on renders it less likely that we get a final plunge. The longer a bear market is, the less severe it tends to be in price and the less likely it terminates with a final plunge. For example, the 1996-1999 bear declined only 3% in its last 11 weeks. In other words, if this bear is to make a new low and break $1200 on a weekly basis, I doubt it plunges from there as much as people would think. There aren’t as many players left in this market as there were a year ago, two years ago and three years ago.
Aside from the typical Gold in US$ chart it’s always important to consider Gold in the context of various currencies and the equity market. In the chart below we plot Gold against a foreign currency basket and against the S&P 500. The first plot shows that Gold hasn’t made a double bottom but is still in a series of lower lows and lower highs. The positive is Gold is has rallied up to trendline resistance several times already. I think Gold will be in position to break the trendline by the end of summer. If that happens, the bear market is over.
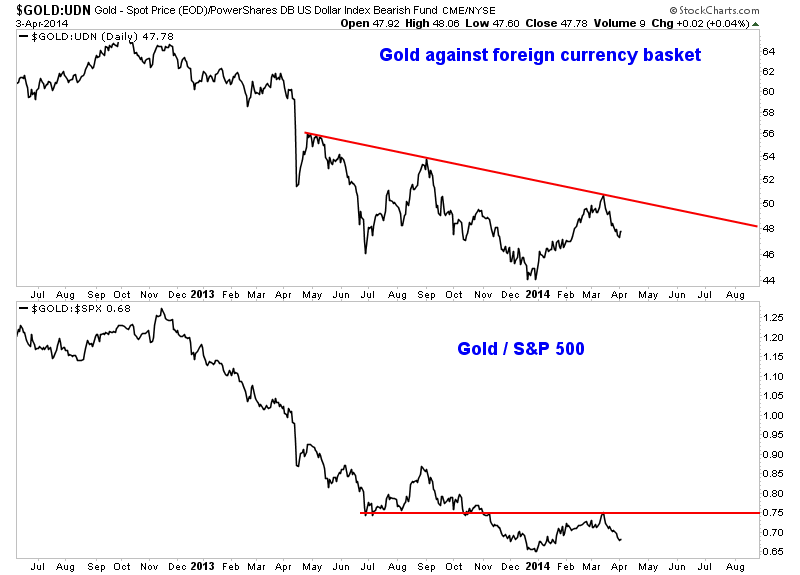
Meanwhile, Gold has obviously struggled against the S&P 500. We all are aware of the negative correlation between the two markets which started just after Gold peaked in August 2011. If Gold is to begin a new bull market in earnest then it really needs to reverse itself against the S&P 500. The ratio has clear resistance at 0.75 which is important resistance dating back to July 2013. The ratio has traded below 0.75 for the past five months, a period in which many stocks rebounded strongly. If the ratio can move back above 0.75 it would make a very strong case for Gold’s bottom being in place.
We just don’t have enough evidence to know at this point. I continue to maintain that the mining stocks (and definitely the juniors) have bottomed. GDXJ and SILJ would have to decline 24% to test their daily lows. GLDX would have to decline 27%. The mining stocks led the move down and have led this fledgling recovery. I think they continue to lead. However, it appears that they won’t sustain a rebound and push much higher until after the metals have bottomed.
My conclusion on Gold is if it breaks to a new low then a final bottom is imminent. If it breaks above $1400 and the resistance in the aforementioned charts, then it has bottomed. Yet, Gold and the mining stocks could continue to be range bound for several months and deny us an immediate answer. At worst it would bring us much closer to the end and the start of a new bull market. Rick Rule, who was very prescient during the recent downturn recently stated that he thinks we are seeing a saucer type bottom and that 12 to 18 months from now we will be in a rip roaring bull market. Consider that it takes an uptrend to develop to create the momentum that leads to the rip roaring part. I believe we have no more than several months left to accumulate the best stocks which are positioned to benefit from the coming resumption of the secular bull market.
If you'd be interested in professional guidance in this endeavor, then we invite you to learn more about our service.
Good Luck!
Bio: Jordan Roy-Byrne, CMT is a Chartered Market Technician, a member of the Market Technicians Association and from 2010-2013 an official contributor to the CME Group, the largest futures exchange in the world. He is the publisher and editor of TheDailyGold Premium, a publication which emphaszies market timing and stock selection for the sophisticated investor. Jordan's work has been featured in CNBC, Barrons, Financial Times Alphaville, and his editorials are regularly published in 321gold, Gold-Eagle, FinancialSense, GoldSeek, Kitco and Yahoo Finance. He is quoted regularly in Barrons. Jordan was a speaker at PDAC 2012, the largest mining conference in the world.
Jordan Roy-Byrne Archive |
© 2005-2022 http://www.MarketOracle.co.uk - The Market Oracle is a FREE Daily Financial Markets Analysis & Forecasting online publication.