


Gold Price Short-Term Bottom Coming Due
Commodities / Gold and Silver 2014 Jun 02, 2014 - 11:23 AM GMTBy: Jim_Curry

 In light of the recent developments in the Gold market, I wanted to post an article on the current cyclic configuration - and what we can expect in the very near future. Since my prior article back in December of last year, we have seen the expected larger countertrend rally with the combination of the 72 and 154-day cycles, which were able to take the metal up to a mid-March peak of 1392.80. The chart below shows the larger 154-day component, which is seen as heading lower into the month of August, which is plus or minus a month in either direction:
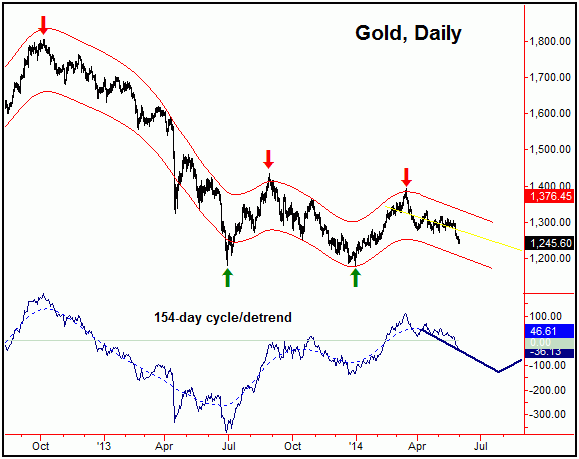
With the position of this larger 154-day wave, the current assumption is that any new rally should end up as a countertrend affair, and - once complete - should be followed by an eventual re-test or break below the December, 2013 bottom of 1181.30. Having said that, there are bullish indications for the very short-term, which is the main subject of this article. The next chart is more important to the near-term action. It shows the 34-day cycle, which is one of the more dominant of the short-term cycles in the Gold market:
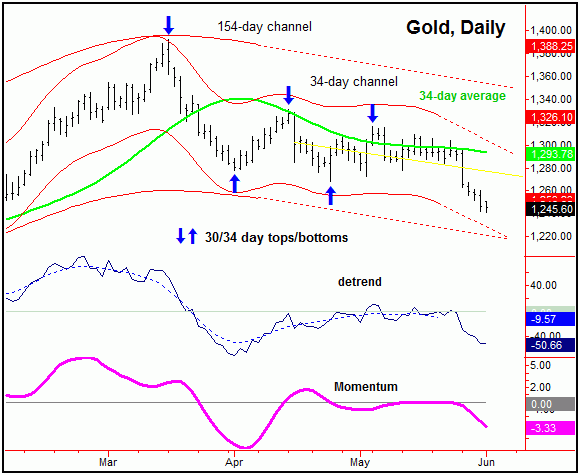
Of immediate note is that the 34-day channel is also pointing south, and is closing in on the lower 154-day channel line. With that, we should be nearing at least a short-term bottom for the metal, with a sharp rally soon favored to materialize, though we can’t rule out slightly lower numbers being seen first. Once this 34-day wave does bottom out, then the normal low-end expectation is for a rally back to the 34-day moving average or higher, with that key moving average currently at the 1293 figure (and declining).
In addition to the 34-day cycle, there is also a less-dominant 10-day component, which is also due for an extended bottom anywhere in the current timeframe. This cycle is seen on the chart below:
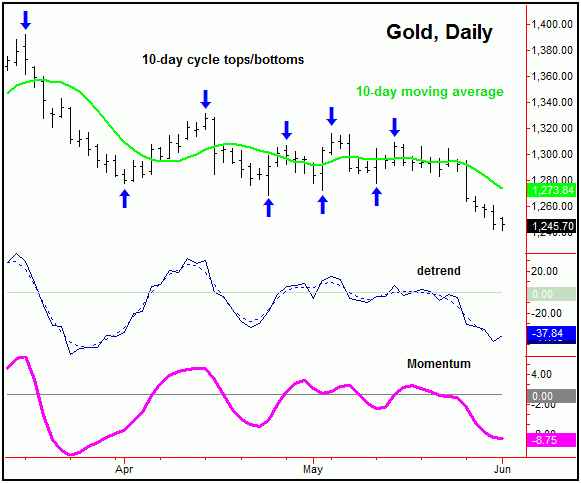
With the above said and noted, we then have both the shorter-term 10 and 34-day waves at or into bottoming range, and with that the current assumption is that the next decent swing low on the daily chart will come from these two waves. In terms of price, any reversal back above the 1262.50 figure on Gold – if seen at any point in the coming days – would tend to confirm an upturn in the 10-day cycle, and likely that of the larger 34-day wave as well.
Adding to the notes above, I pointed out in some of my recent market commentaries that taking out the 1289.00 figure on Gold favored a test of the 1277.00 number - and taking that figure out to the downside then confirmed the downward phase of the aforementioned 34-day cycle to be back in force. I like to take a detailed look at how each of the up and downward phases have played out in the past history of each of the cycles that I track, in order to get some idea of what to expect in the near-future. With that, taking out the 1277.00 figure favored a drop on down to the 1254 area or lower, simply due to a normal low-end statistical expectation with the 34-day wave.
Going a bit further, the chart below is the most important chart that I track, which shows the daily cycle turning point forecast (in aqua), which is a combination of the dominant cycles on the daily chart of the price of gold. The larger weekly cycle forecast is overlaid (also in aqua), and is pointing lower - which is in line with the position of the larger 72 and 154-day waves. Take a look:
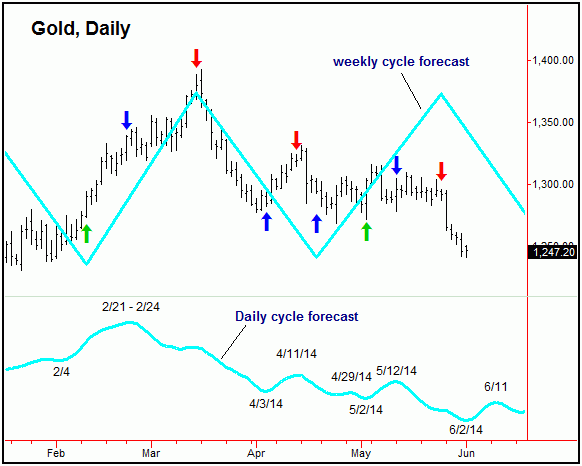
On the above chart, the most important periods are when both the daily and weekly forecast paths are moving in the same direction. With this, I have labeled with red/blue/green arrows the times that both the daily and the weekly forecasts line up together. The green arrows show when both forecasts are moving higher (i.e., a ‘buy’ signal with the model), and red arrows are when both models are forecasting lower prices (i.e., a ‘sell’ signal). A blue arrow is shown when the models are in disagreement (i.e., a ‘neutral’ signal).
With the above said and noted, we can see that when both forecast paths are in alignment, that the market tends to move strongly in that direction. I should add that, when the daily and weekly forecasts disagree, that the market has more of a tendency to follow the shorter-term (daily) forecast path.
With that, of particular note for the near-term is that the next daily forecast bottom is projected for the 6/2/14 date, which is Monday of this week and is plus or minus a day or so in either direction. Thus, the continued weakness seen into Friday looks to be in line with the next bottom for the daily forecast path – which, ideally, should also end up as the bottom for the aforementioned 10 and 34-day time cycles.
Summing up the above, the short-term path favors a bottom fairly soon (i.e., 6/2/14, plus or minus) and at least a sharp bounce into what is looking to be June 11th, plus or minus, which is the next daily forecast peak. Until a lower level actually materializes, any reversal back above the 1262.50 figure going forward, if seen, would likely confirm that move up to be in progress, while remaining below the same allows for a continued break down to the 1230’s first, only then to set up this bottom.
Jim Curry
Market Turns Advisory
Email: jcurry@cycle-wave.com
Jim Curry is the editor and publisher of Market Turns advisory, which specializes in using cyclical analysis to time the markets. To be added to our mailing list click HERE
Copyright 2013, Jim Curry - Disclaimer - The financial markets are risky. Investing is risky. Past performance does not guarantee future performance. The foregoing has been prepared solely for informational purposes and is not a solicitation, or an offer to buy or sell any security. Opinions are based on historical research and data believed reliable, but there is no guarantee that future results will be profitable. The methods used to form opinions are highly probable and as you follow them for some time you can gain confidence in them. The market can and will do the unexpected, use the sell stops provided to assist in risk avoidance. Not responsible for errors or omissions.
Jim Curry Archive |
© 2005-2022 http://www.MarketOracle.co.uk - The Market Oracle is a FREE Daily Financial Markets Analysis & Forecasting online publication.