


Gold and Silver Price False Break Lows?
Commodities / Gold and Silver 2014 Sep 04, 2014 - 12:21 PM GMTBy: Austin_Galt

 Both gold and silver have embarked on early week moves down. These moves reek of attempts to flush out the weak hands. Many of those bulls still remaining would surely have a good case of the heebie jeebies right about now. While I am also a bull, currently holding long silver positions, I have found the move less intimidating as I was expecting these downmoves. Although I must admit to getting a slight twitch come the end of trading on Tuesday! Let's investigate.
Gold Daily Chart
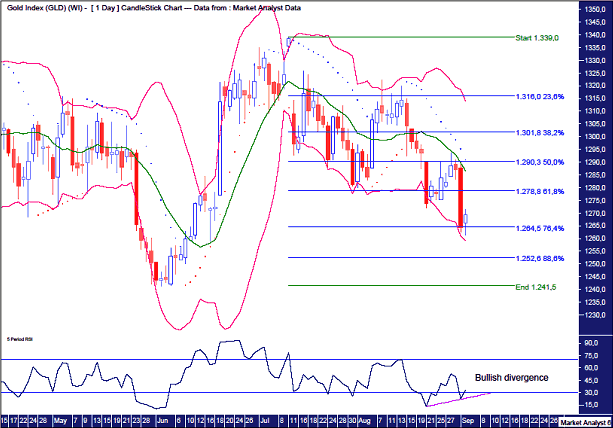
I have added Bollinger Bands and we can see this move down has gone from the middle band back down to the lower band. The question now is will there be strong follow through to the downside that clings to the lower band or will it bounce right off it and head back up? I favour the latter.
I have added Fibonacci retracement levels and price has now hit the 76.4% level. Perhaps that will provide the foundation for a turn and move back up.
I have also added a Parabolic Stop and Reverse (PSAR) indicator just to demonstrate the corrective nature of trading since the July high. The dots have been busted every which way since that top. Price has been all over the place. Now compare that to the recent move up which seemed of an impulsive nature.
Finally, I have added a Relative Strength Indicator (RSI) which shows this current low being accompanied by a higher RSI reading. A bullish divergence.
Let's move on to silver.
Silver Daily Chart

The Bollinger Bands once again show price coming back to the lower band. One last kiss goodbye perhaps? I hope so.
The low on Tuesday was at US$19.09. This is also where it closed. This low could well have exhausted the sellers.
The previous week's low was bang on the 76.4% level. Price has now busted through but without any follow through to the downside, we may well have a false break low on our hands. If that is the case, then price should turn around and start to move up. This move up should be, to quote the great South African/English cricketer Tony Greig, "hard and fast".
I have also added the RSI which is showing a triple bullish divergence. Interestingly, the third and current RSI reading is 20.30 while the second divergence showed a reading of 20.31. That is a double bottom on the RSI. And it is a double bottom with the trend as the first RSI reading was below those levels. This should lead to a powerful move up! This is very interesting indeed!!
I suspect the move down this week would have been the last straw for many bulls. Not me though. While it can be a bit nervewracking, if you have confidence in the analysis then it is just a matter of putting stops well away from the market and staying solid.
Both gold and silver have marginally broken their previous week's lows. This looks like the washout of selling which was mentioned as a possibility in a recent report. If prices can now turn around and move up strongly, we will likely have false break lows in place and the next leg up above the July highs in progress.
As for me, apart from breaking my general rule of not trading against the main trend, I have just broken another by averaging down. I have added to current long positions down at these levels. But just in a small way. All that is left to do now is resort to positive thinking. C'mon!!!
Bio
I have studied charts for over 20 years and currently am a private trader. Several years ago I worked as a licensed advisor with a well known Australian stock broker. While there was an abundance of fundamental analysts there seemed to be a dearth of technical analysts, at least ones that had a reasonable idea of things. So my aim here is to provide my view of technical analysis that is both intriguing and misunderstood by many. I like to refer to it as the black magic of stock market analysis.
Please register your interest in my website coming soon. Any questions or suggestions, please contact austingalt@hotmail.com
© 2014 Copyright Austin Galt - All Rights Reserved
Disclaimer: The above is a matter of opinion provided for general information purposes only and is not intended as investment advice. Information and analysis above are derived from sources and utilising methods believed to be reliable, but we cannot accept responsibility for any losses you may incur as a result of this analysis.
© 2005-2022 http://www.MarketOracle.co.uk - The Market Oracle is a FREE Daily Financial Markets Analysis & Forecasting online publication.