Remember, Remember, Gold in September
Commodities / Gold and Silver 2014 Sep 05, 2014 - 10:54 AM GMTBy: Frank_Holmes

 In American poet W. S. Merwin’s poem “To the Light of September,” the speaker calls the ninth month “still summer,” yet with a “glint of bronze in the chill mornings.”
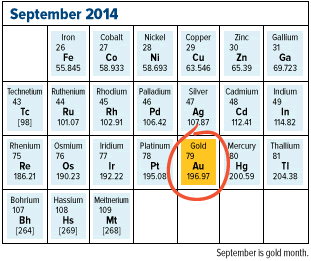
I agree—to an extent. Here in San Antonio, Texas, home of U.S. Global Investors, we’re most definitely still in the summer season. But in the investing world, when we talk about September, there’s a glint not of bronze but another precious metal: gold.
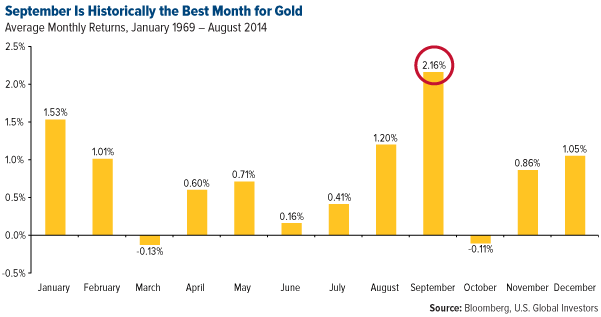
That’s because September is historically gold’s best-performing month of the year, returning 2.16 percent on average since 1969.

I invite you to compare the chart above, updated to reflect the most recent monthly returns, to the one published this time last year.
Drivers of Gold
 There are several seasonal factors that explain why gold glitters a little more brightly in September. The most notable reason is what I call the Love Trade. In India, this month marks some of the most spirited gold-buying in anticipation of Diwali, which falls on October 23 this year. Following closely behind is the Indian wedding season, when gold is purchased for the bridal trousseau and as gifts in jewelry form. And September is normally when retailers restock their wares ahead of Christmas and after the Islamic month of Ramadan, at the end of which gold jewelry is commonly exchanged.
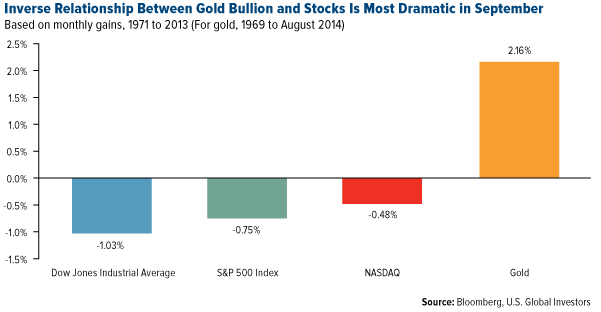
Another explanation might also be the inverse relationship between bullion and stocks, which only becomes more apparent in September. Earlier this week I discussed how September is historically the worst month of the year to trade stocks in. It’s very possible that many investors turn to gold in September, knowing that the month’s stock returns are typically poor.

The yellow metal had a tough 2013—its worst since 1981, in fact—and in September its price fell 5 percent, from $1,396 an ounce to $1,327. Although a movement such as this is generally normal for gold, a loss in the ninth month is somewhat rare. In the last 20 years, there have been only five Septembers in which gold prices ended lower than they started at: 1996, 2000, 2006, 2011 and 2013. That’s once every three and a half years on average.
We’re only a few days into the month, and so far spot prices have dropped about 1.6 percent. But this is completely in line with gold’s normal behavior. As I pointed out in the second part of “Managing Expectations,” it has a daily standard deviation of ±1 percent.
Be sure to check out our Gold and Precious Metals Fund (USERX), recognized by Morningstar with a four-star rating*. Also, to find out which countries contribute the most gold annually, explore our updated interactive “Global Gold Mining Production” map.
By Frank Holmes
CEO and Chief Investment Officer
U.S. Global Investors
U.S. Global Investors, Inc. is an investment management firm specializing in gold, natural resources, emerging markets and global infrastructure opportunities around the world. The company, headquartered in San Antonio, Texas, manages 13 no-load mutual funds in the U.S. Global Investors fund family, as well as funds for international clients.
All opinions expressed and data provided are subject to change without notice. Some of these opinions may not be appropriate to every investor.Standard deviation is a measure of the dispersion of a set of data from its mean. The more spread apart the data, the higher the deviation. Standard deviation is also known as historical volatility. All opinions expressed and data provided are subject to change without notice. Some of these opinions may not be appropriate to every investor. The S&P 500 Stock Index is a widely recognized capitalization-weighted index of 500 common stock prices in U.S. companies. The NYSE Arca Gold BUGS (Basket of Unhedged Gold Stocks) Index (HUI) is a modified equal dollar weighted index of companies involved in gold mining. The HUI Index was designed to provide significant exposure to near term movements in gold prices by including companies that do not hedge their gold production beyond 1.5 years. The MSCI Emerging Markets Index is a free float-adjusted market capitalization index that is designed to measure equity market performance in the global emerging markets. The U.S. Trade Weighted Dollar Index provides a general indication of the international value of the U.S. dollar.
Frank Holmes Archive |
© 2005-2022 http://www.MarketOracle.co.uk - The Market Oracle is a FREE Daily Financial Markets Analysis & Forecasting online publication.


