


Gold $1200 Underpinned by Physical Demand
Commodities / Gold and Silver 2014 Sep 26, 2014 - 03:30 PM GMTBy: Alasdair_Macleod

 This week saw gold rally $15 to $1233 on Tuesday before sliding to $1207 yesterday morning, then rallying in the afternoon. Silver's moves tracked gold's, bottoming out at $17.30 yesterday at the London opening. This morning precious metals are firmer in pre-LBMA trade, reflecting some short-covering ahead of the weekend.
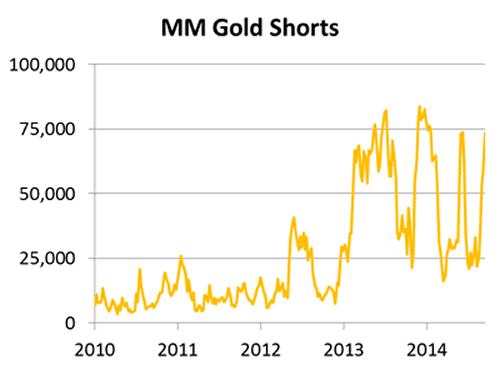
The action, as has often been the case recently, is in paper markets with hedge funds shorting gold and silver against a strong dollar. This can be readily seen in the following chart of Managed Money shorts on Comex, which is back in record oversold territory. The chart of silver is similar.
The analysts encouraging fund managers to sell gold are mostly working for the investment and bullion banks, and it turns out that their traders are buying it, closing their bear positions. This is shown in the next chart of Swaps, which represents mostly the aggregate futures positions of the non-American bullion banks.
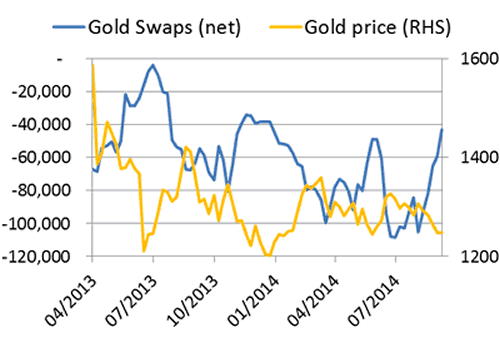
So the swaps have reduced their net shorts by over 60,000 contracts (190 tonnes) over the last five weeks. The next chart is of the largest four traders, which are mainly the American bullion banks.
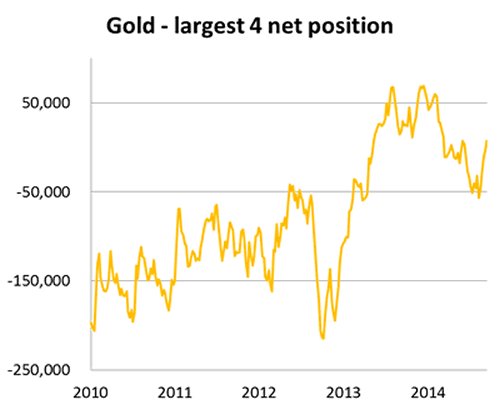
Here again, over the last five weeks they have bought back about 200 tonnes, which added to the swaps makes nearly 400 tonnes, bought over the last month-and-a-bit by banks whose analysts are mostly encouraging the public to sell. As they say, go figure.
This does not mean that gold and silver won't go lower next week: we will only know that with hindsight. But it is going to get more difficult for the bullion banks to close their shorts from here for the following reasons: the weak hands have now mostly sold, and there is increasing evidence (mostly anecdotal admittedly) of growing physical demand for delivery. This varies from wealthy investors taking a long-term view, to the pre-Diwali season stock-building reflected in centres such as Dubai, as well as the usual suspects such as the Chinese and Russians. In fact this morning the Shanghai Gold Exchange reported deliveries rose to over 50 tonnes in the week to 19th September. This is the highest weekly delivery since February, and at current prices SGE demand could turn out to be even higher this week.
A brief mention on silver: between Thursday 18th and yesterday, the equivalent of 48,265,000 ounces were swapped for 9,630 Comex December contracts (Exchange for Physical, or EFP). On Tuesday the volume of futures and options was exceptionally high, Open Interest fell 5,501 contracts, and 2,489 contracts were exchanged for physical. Could it be that this silver was required to be delivered to other markets, such as Shanghai, where stocks are depleted and silver is trading at a price premium?
Could it be that the acceleration of demand for silver eagles is indicative of the demand for physical silver at these low prices? If so, it is an indication that Comex is pricing silver futures too low to reflect genuine demand, and the price will struggle to go lower.
Next week
Monday. UK: BoE Mortgage Approvals, Net Consumer Credit, Secured Lending, M4 Money Supply. Eurozone: Business Climate Index, Economic Sentiment, Industrial Sentiment, Consumer Sentiment. US: Core PCE Price Index, personal Income, Personal Spending. Japan: Real Household Spending, Unemployment, Industrial Production, Retail Sales.
Tuesday. Japan: Housing Starts, Construction Orders, Tankan Survey. UK: Nationwide House Prices, Current Account, GDP (3rd est.), Index of Services. Eurozone: Flash HICP, Unemployment. US: Case-Shiller Home Price, Chicago PMI.
Wednesday. Japan: Vehicle Sales. Eurozone: Manufacturing PMI. US: Manufacturing PMI, ADP Employment Survey, Construction Spending, ISM Manufacturing, Vehicle Sales.
Thursday. Eurozone: PPI, ECB Deposit Rate, Refinancing Rate. US: Initial Claims, Factory orders.
Friday. Eurozone: Services PMI, Composite PMI, Retail Trade. US: Non-Farm Payrolls, Private Payrolls, Trade Balance, Unemployment.
Alasdair Macleod
Head of research, GoldMoney
Alasdair.Macleod@GoldMoney.com
Alasdair Macleod runs FinanceAndEconomics.org, a website dedicated to sound money and demystifying finance and economics. Alasdair has a background as a stockbroker, banker and economist. He is also a contributor to GoldMoney - The best way to buy gold online.
© 2014 Copyright Alasdair Macleod - All Rights Reserved
Disclaimer: The above is a matter of opinion provided for general information purposes only and is not intended as investment advice. Information and analysis above are derived from sources and utilising methods believed to be reliable, but we cannot accept responsibility for any losses you may incur as a result of this analysis. Individuals should consult with their personal financial advisors.
Alasdair Macleod Archive |
© 2005-2022 http://www.MarketOracle.co.uk - The Market Oracle is a FREE Daily Financial Markets Analysis & Forecasting online publication.