


Gold Price Very Close to an Important Low
Commodities / Gold and Silver 2014 Sep 29, 2014 - 01:48 PM GMTBy: Clive_Maund

 Some of you may remember those gold ingot vending machines that started to pop up at airports and other places several years ago, which were of course a sign of a top. If they are still there they have probably been reconfigured to dispense cans of coke and candy, and if so it's a positive sign for gold.
Gold is set up to rally soon because it is oversold, with its COTs and sentiment readings at extremes characteristic of a bottom and also because the dollar is wildly overbought and out on a limb, and looking vulnerable to a reaction.
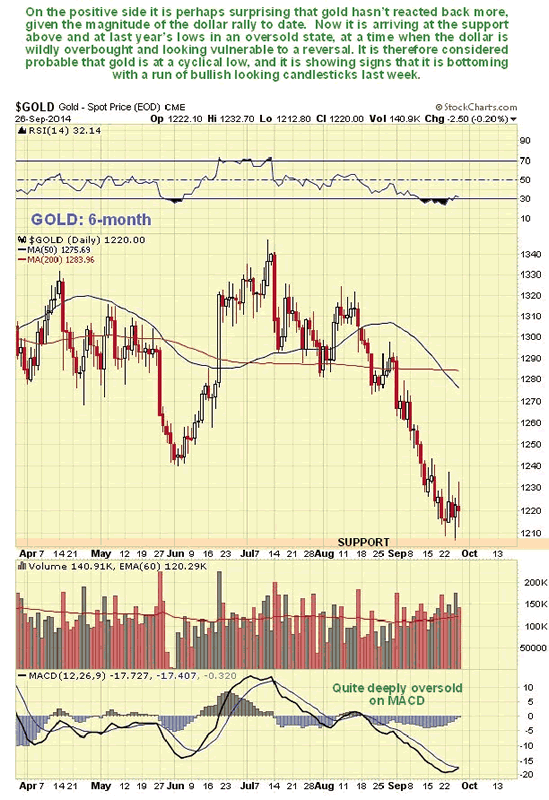
On gold's 6-month chart we can see that after a rather steep drop this month, gold has been trying to base over the past week, with a run of more bullish looking candlesticks appearing on its chart. It is oversold on short and medium-term oscillators and in a zone of support above its lows of last June and December - a good point to turn up.
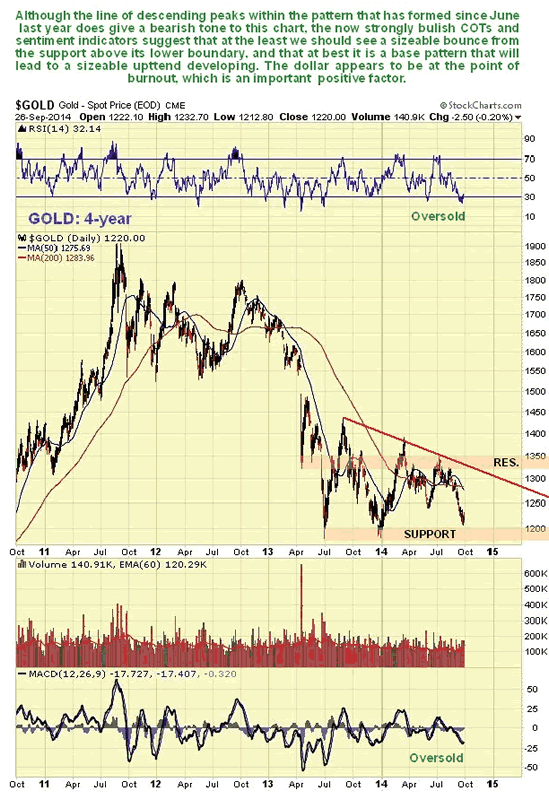
On its 4-year chart we can see that gold is still within the large potential base pattern that started to form in June of last year, and towards the support at its lower boundary. While this supposed base could be a continuation pattern leading to renewed decline, COTs and sentiment indicators suggest that it is indeed a base pattern and that gold will now turn higher.
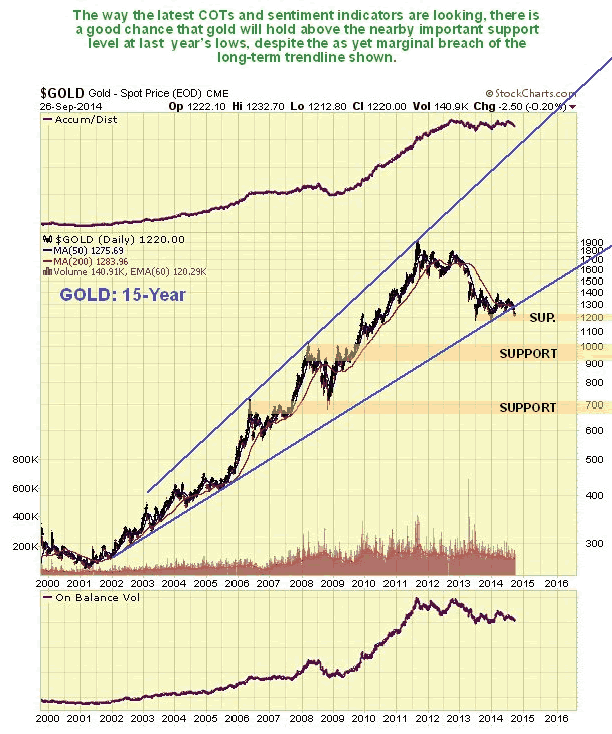
On its 15-year chart we can see that gold has apparently started to break down from its long-term uptrend, but so far the break is marginal, and the now positive COTs and sentiment indicators suggest that it is a false break - a bear trap - and that gold will soon turn higher again, and may begin a major new uptrend.
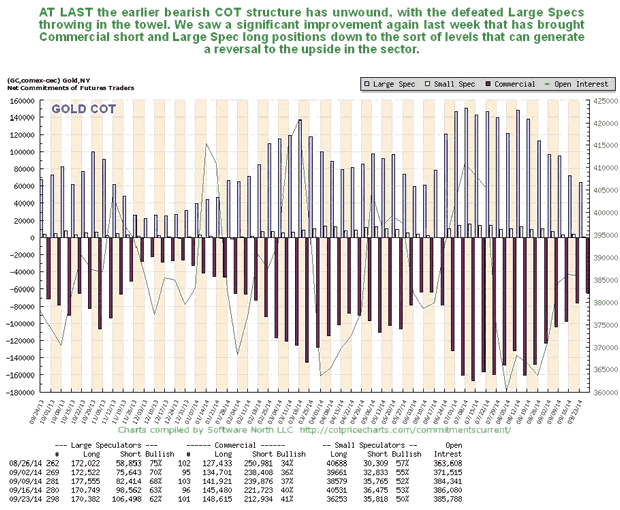
Gold's latest COT is encouraging for bulls as it shows that readings have continued to moderate to the point that they can now be construed as bullish, as Commercial short and Large Spec long positions have dropped to approach levels from which new uptrends have been born in the past. The Large Specs have certainly curbed their enthusiasm, which is a positive sign.
The Gold Hedgers chart shown below, which is a kind of COT chart and goes back further, makes plain that from the standpoint of traders' positions we are now well into bullish territory - readings above the green line are bullish, and we can see that it is now well above this line, and in the past readings such as this have lead to significant rallies, with a similar reading in 2008 leading to an enormous rally. Looks good.
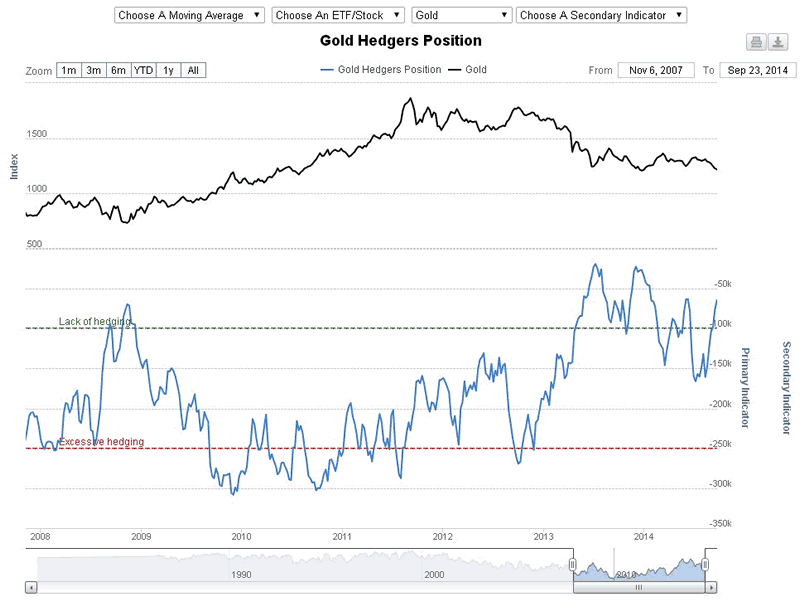
Chart courtesy of www.sentimentrader.com
The Gold Optix (optimism) chart below makes fascinating viewing as it displays the current all-pervasive pessimism towards gold in graphical form. This chart makes plain that we are close to record pessimism, and thus it can be concluded that we are either at, or very close to a bottom.
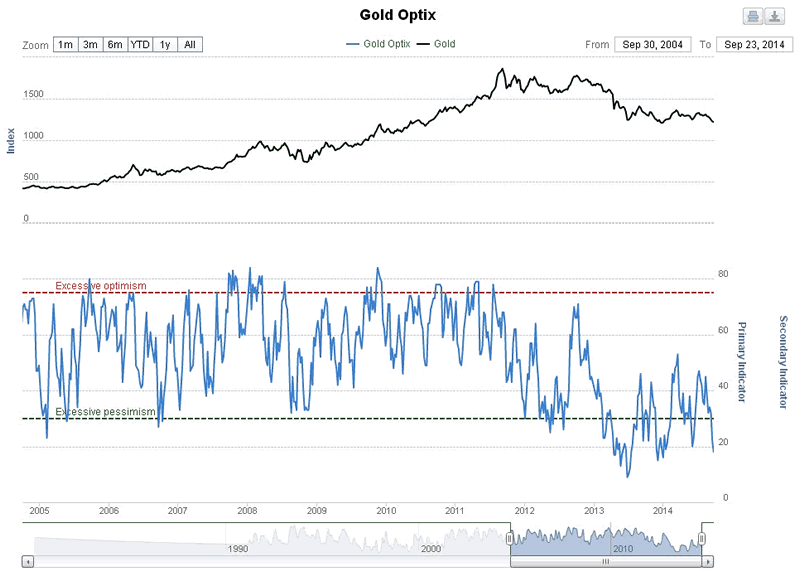
Chart courtesy of www.sentimentrader.com
The whole world is optimistic on the dollar now, probably up to and including IS, which is understandable considering how many greenbacks they have robbed from banks, and sentiment towards it is at wild "off the scale" bullish extremes. For this reason, a correction in the dollar looks imminent, even if it later continues higher for a while, and if it is gold and silver should turn higher. Let's now review the evidence.
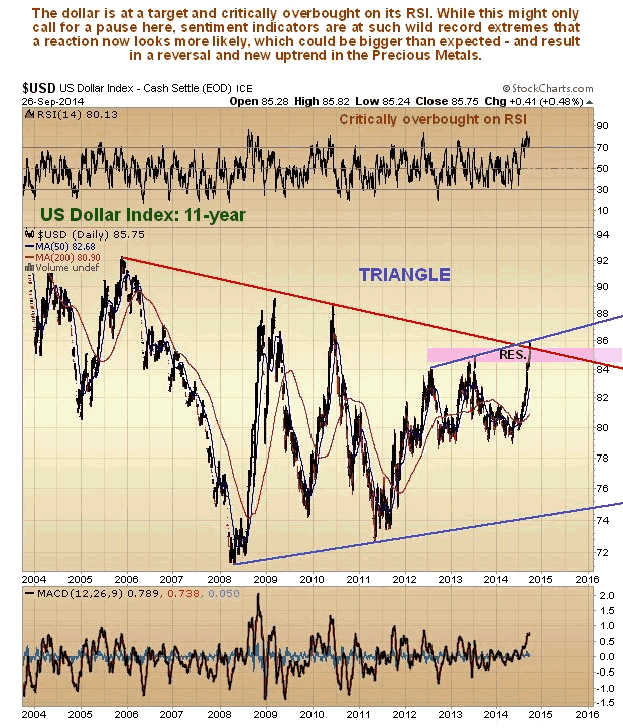
First, the long-term 11-year chart for the dollar index shows the runup of recent weeks in the context of prior pattern development, and while the runup so far doesn't look all that big historically speaking, it has arrived at a twin target and is critically overbought on its RSI indicator.
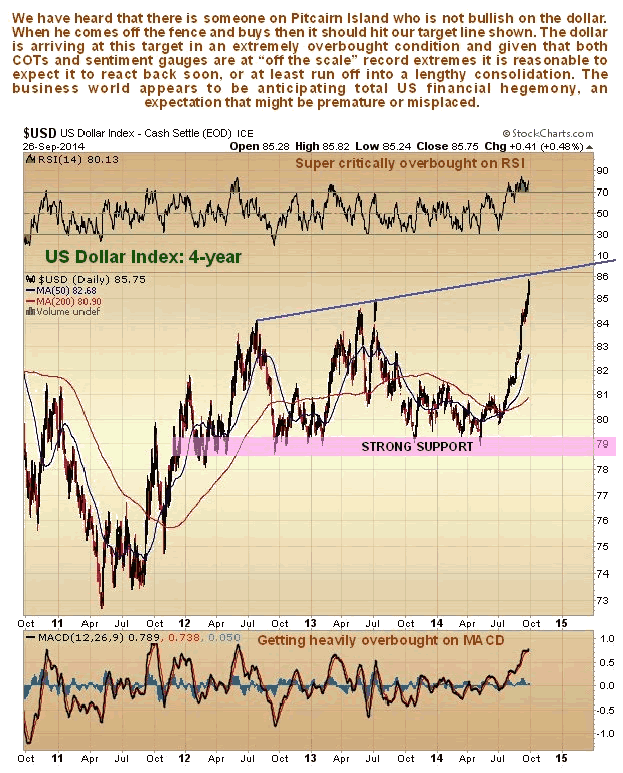
The 4-year chart shows to advantage the dramatic spike in the dollar index, which has resulted in it arriving at the target shown in a wildly overbought state. Thus it is now vulnerable to a sudden reversal.
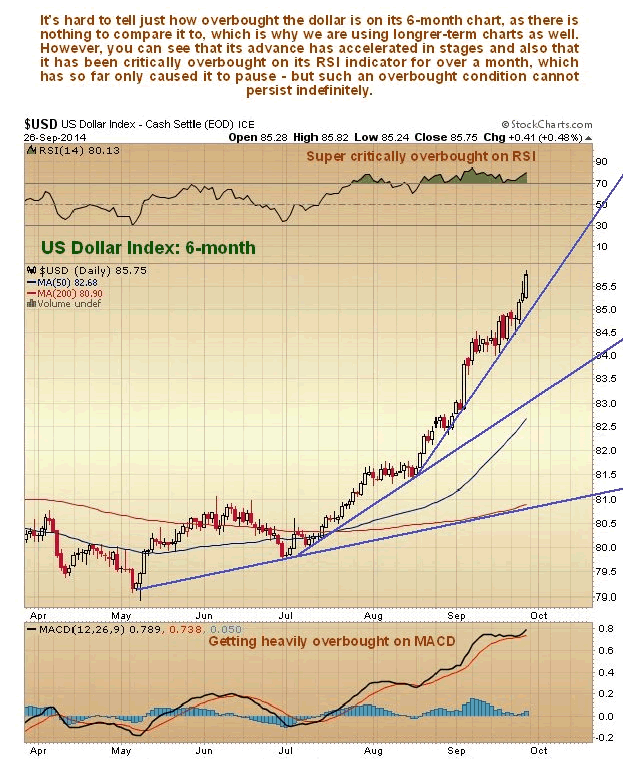
The 6-month shows recent action in detail, and how the dollar's advance has ramped up in stages. The RSI indicator at the top of the chart shows that it has been critically overbought for over a month, a situation which cannot persist indefinitely.
Next, the dollar hedgers chart (COT) shows that positions are already at record extremes - this chart calls for a reversal, and very soon.
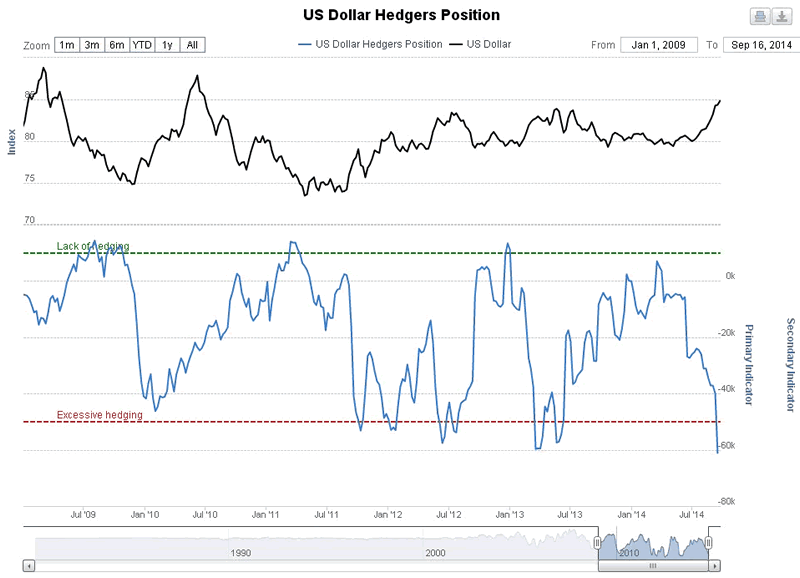
Chart courtesy of www.sentimentrader.com
Meanwhile, the dollar optix or optimism index chart shows that optimism also is already at record extremes and is "off the scale" - optimism is so widespread that Barack Obama no longer feels the need to put his cup down when saluting the military - and here we should note that we are much more worried about the example set to youngsters not by his saluting with a plastic cup in his hand, but that it appears to be a nasty carcinogenic polystyrene cup. The record shows that such wild optix index extremes have almost always coincided with a top or closely preceded it.
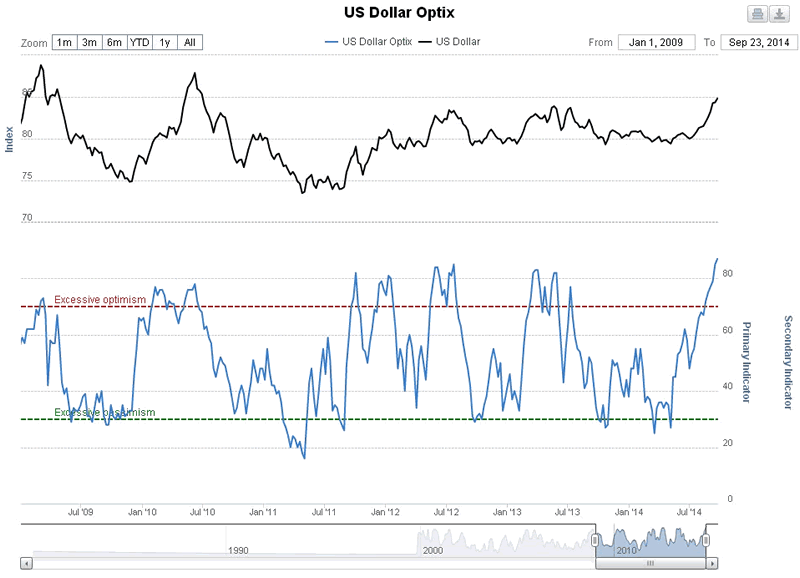
Chart courtesy of www.sentimentrader.com
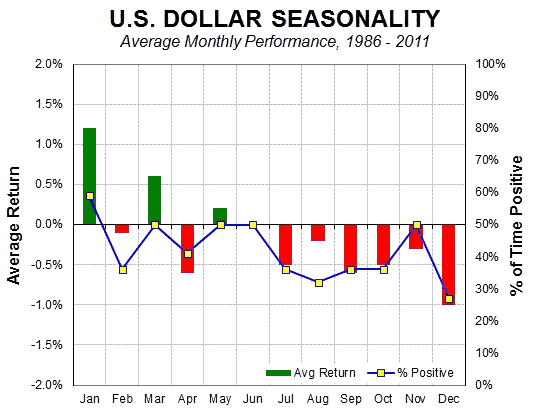
Finally, the dollar seasonal chart, which is admittedly only a background influence, shows that the next few months are not historically the best time of year for the dollar.
Conclusion: we can now emphatically conclude that gold is believed to be either at or very close to an important low here, especially as the dollar looks set to turn lower soon. Only in the event of an immediate all-out across the board deflationary plunge would gold prices be likely to drop further.
By Clive Maund
CliveMaund.com
For billing & subscription questions: subscriptions@clivemaund.com
© 2014 Clive Maund - The above represents the opinion and analysis of Mr. Maund, based on data available to him, at the time of writing. Mr. Maunds opinions are his own, and are not a recommendation or an offer to buy or sell securities. No responsibility can be accepted for losses that may result as a consequence of trading on the basis of this analysis.
Mr. Maund is an independent analyst who receives no compensation of any kind from any groups, individuals or corporations mentioned in his reports. As trading and investing in any financial markets may involve serious risk of loss, Mr. Maund recommends that you consult with a qualified investment advisor, one licensed by appropriate regulatory agencies in your legal jurisdiction and do your own due diligence and research when making any kind of a transaction with financial ramifications.
Clive Maund Archive |
© 2005-2022 http://www.MarketOracle.co.uk - The Market Oracle is a FREE Daily Financial Markets Analysis & Forecasting online publication.