


Silver, Warfare and Welfare
Commodities / Gold and Silver 2014 Oct 14, 2014 - 03:15 PM GMTBy: DeviantInvestor

 US policies that promote warfare and welfare have produced massively increased debt, much higher consumer prices, larger government, and more central bank intrusion into the markets. And yes, higher silver and gold prices also resulted from these policies.
Fifty years ago we were bombing North Vietnam "back into the stone age" while also declaring a "war on poverty." The consequences of both "wars" have not been encouraging. Since then we have created considerable indebtedness by promoting such questionable ideas as a war on Iraq, a war on drugs and a war on terrorism. Future uses of national income and more debt could include a war on ebola, war on ISIS, and many other "wars."
Official national debt has increased from roughly one-third of a $ Trillion in 1964 to nearly $18 Trillion today. The price of a barrel of crude oil has increased from about $1.50 to about $90 over the past 50 years. A pack of cigarettes has increased from a quarter to nearly $6. There are 1,001 more examples of increasing prices, often not matched by increases in personal incomes.
Consumer prices have broadly increased with some price rises far exceeding others - college tuition and healthcare come to mind. Also bonuses on Wall Street have been outstanding.
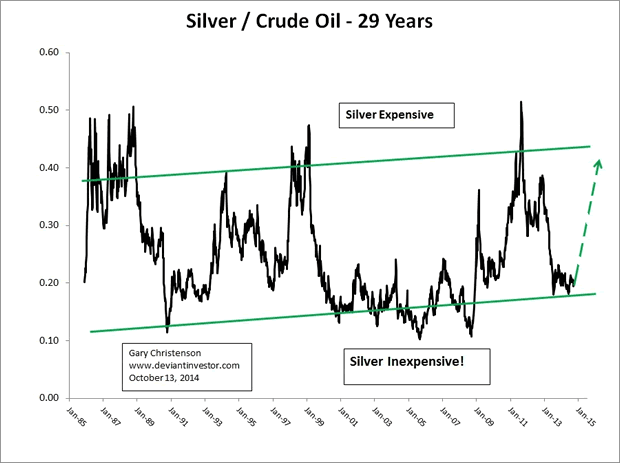
Examine the following graph of silver divided by crude oil. They increase together on average, but silver currently looks inexpensive compared to crude oil. Expect silver to rise in price more rapidly than crude oil.
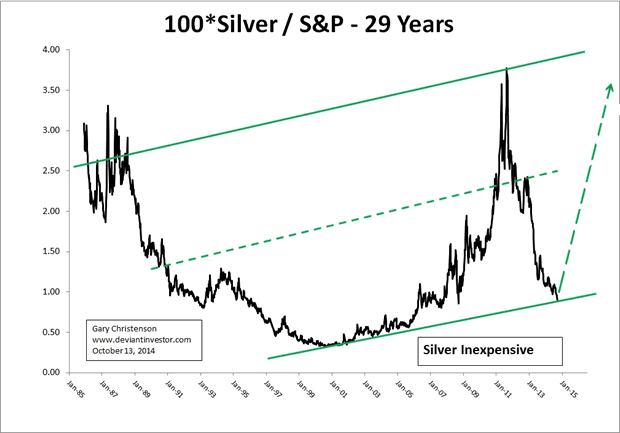
Examine the graph of (100 times) silver divided by the S&P 500 Index. The attractiveness of financial assets (S&P) varies widely compared to the need for hard assets such as silver and gold. Note that the ratio has dropped from over 3 to less than 1 in the past 3 years. Expect silver to rally substantially compared to the S&P.
Do you expect the emphasis upon warfare and welfare to change? Do you expect fewer dollars to be created? Do you expect central banks will self-destruct by allowing interest rates to rise and/or deflationary forces to overwhelm the economy?
An accident where the financial elite are hurt more than the masses could happen but it seems like an unlikely scenario. Hence, as with the past 50 years, expect more currency in circulation, much more debt, higher consumer prices, more warfare, and more welfare.
Further, expect the prices for silver and gold to increase relative to the S&P, and expect silver prices to increase more rapidly than the price of crude oil.
Inevitable? Certainly not, but the best overall predictor of future prices, future policies, and future wars seems to be the long term trends shown by past prices, policies, and wars.
Unless (until) something unlikely and world changing occurs, we should expect:
- More warfare
- More welfare
- Increasing consumer prices
- More debt
- More government statistics proving everything is wonderful in election years
- More volatility, anxiety, worry, and concern over markets, ebola, war, the NSA, which insider will purchase the presidency etc.
- More gold and silver coins sold to Americans and Europeans who increasingly distrust paper assets.
- More gold and silver purchases by Asian individuals and governments who increasingly distrust paper assets.
- More talk-talk on financial TV about the great stock buying opportunities available in 2014, 2015, 2016, and through 2030.
Silver is currently inexpensive compared to the S&P 500 Index, crude oil, the size and rate of increase of the national debt, and especially the future price for silver after markets have reset, paper assets have devalued, and hard assets have jumped much higher in price.
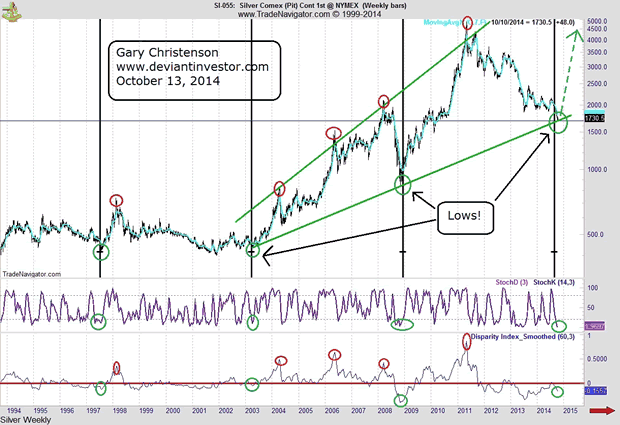
Examine the following graph of weekly silver prices since 1994. Based on the stochastic index and the disparity index (and many more such indicators that are not shown) silver prices are ready to rally. The black vertical lines are spaced 5.75 years apart and they show significant lows in silver prices in 1997, 2003, 2008, and about now. Guarantee? No! Probability? Yes!
GE Christenson aka Deviant Investor If you would like to be updated on new blog posts, please subscribe to my RSS Feed or e-mail
© 2014 Copyright Deviant Investor - All Rights Reserved Disclaimer: The above is a matter of opinion provided for general information purposes only and is not intended as investment advice. Information and analysis above are derived from sources and utilising methods believed to be reliable, but we cannot accept responsibility for any losses you may incur as a result of this analysis. Individuals should consult with their personal financial advisors.
© 2005-2022 http://www.MarketOracle.co.uk - The Market Oracle is a FREE Daily Financial Markets Analysis & Forecasting online publication.