


Natural Gas Price Forecast
Commodities / Natural Gas Mar 14, 2015 - 03:17 PM GMTBy: Austin_Galt

 Natural gas has been absolutely pummelled for the last decade after making an all time high in 2005 at US$15.78. Price now sits around US$2.75. What a spanking!
So, does there look to be an end in sight to this devastating downtrend? Yes and no. Let's begin with the "no" which involves the big picture yearly chart.
Natural Gas Yearly Chart
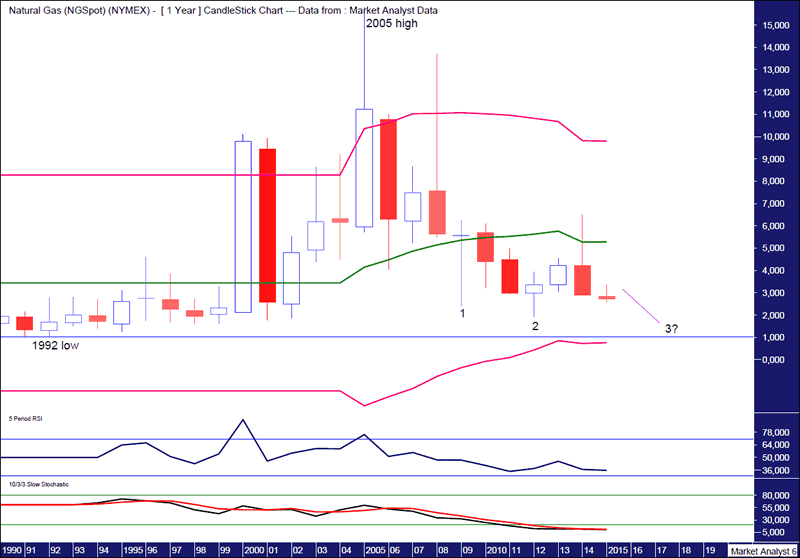
We can see price has been smashed from that 2005 high which has caused immense misery for the bulls. The picture that flashes before me is the scene from Frank Herbert's 1984 movie Dune whereby Paul Atreides puts his hand in the pain box and exclaims, "The pain!" Well, the natural gas bulls are currently ensconced in their own pain box.
There looks to be a "three strikes and you're out" low setting up which consists of three consecutive lower lows. This is denoted by the numbers 1, 2 and 3. Now, due to the massive bear trend in play, consideration also needs to be given to a fourth strike which would really nail down the low if that were to occur. And this is the yearly chart, no less, so there still appears to be plenty of time left in this bear market.
The Relative Strength Indicator (RSI) is looking weak but the next low looks like it might set up a bearish divergence.
The Stochastic indicator is still trending down with a bearish bias so no joy there either for the bulls.
So where is the final low likely to be? Good question and I must admit to be quite unsure about that.
I have drawn a horizontal line denoting the 1992 low which stands at US$1.02. For now I favour the final low to be just above that level but it really would not surprise me to see price nudge a bit below.
I have added Bollinger Bands and price now looks headed for the lower band which is currently at 76c and rising slowly.
There still looks to be at least 3 years before we might start contemplating a low and that is probably underestimating how much longer this bear trend has left in it.
Let's now go to the "yes" which involves the weekly chart.
Natural Gas Weekly Chart
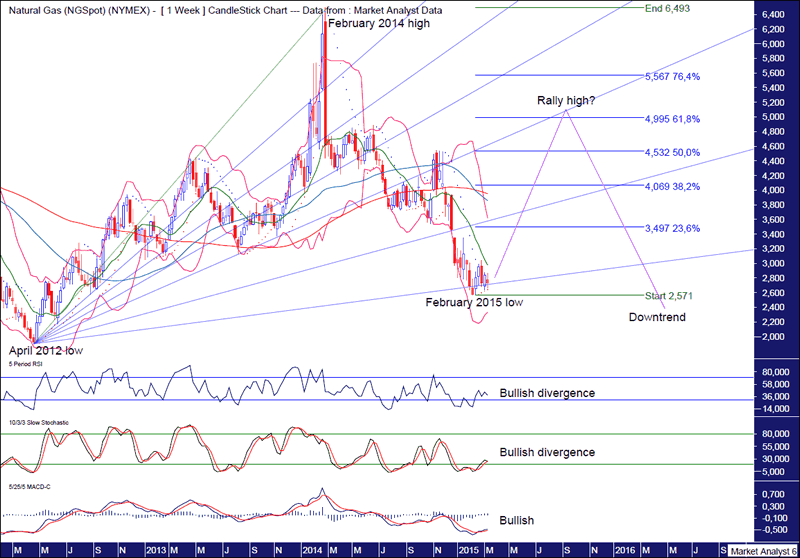
I have added a Fibonacci Fan and price looks to be finding support at the 88.6% angle. I often see price stage significant rallies off this fan angle and I think we are about to see that here.
The Parabolic Stop and Reverse (PSAR) indicator now has a bullish bias after price busted the dots on the upside a few weeks ago.
The RSI and Stochastic indicator are both showing a bullish divergence on the recent low while the Moving Average Convergence Divergence (MACD) indicator is showing a recent bullish crossover.
The Bollinger Bands show price has moved away from the lower band and is now just under the middle band. Sure, it is possible for price to break lower but that would likely see price bounce back up off the lower band.
So, the evidence is mounting that a decent rally is set to commence if it hasn't already.
The 100 period moving average (red) has just made a bearish crossover of the 50 period moving average (blue) however I often find price rallies after this event.
Assuming we have a low in place, I have added Fibonacci retracement levels of the move down from February 2014 high to February 2015 low. I favour price rallying up to around the 61.8% level at US$4.99 and perhaps a touch above which might also be around resistance from the 61.8% fan angle if the timing is right for a high around September this year. Let's see.
After the expected rally high, price should head back down as the overall downtrend once again asserts its authority.
Let's wrap it up with the monthly chart.
Natural Gas Monthly Chart
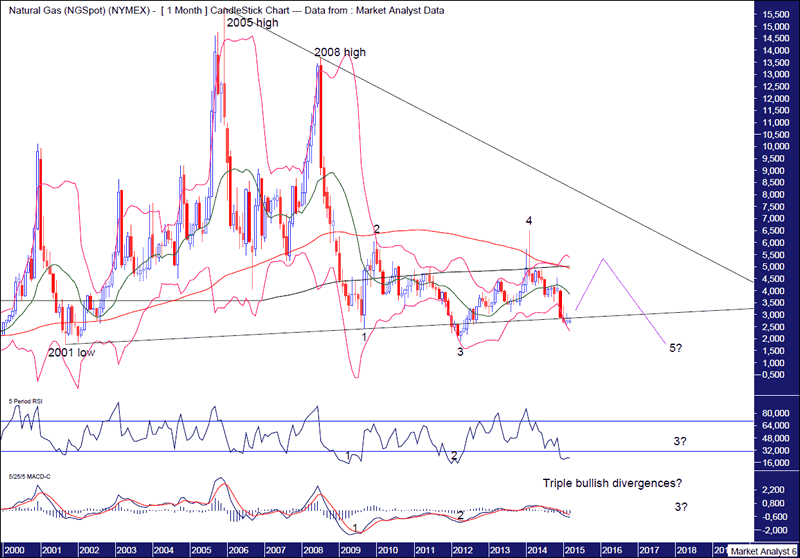
There looks to be a 5 point broadening low in play denoted by the numbers 1 to 5. Price looks to be tracing its way to the point 5 low but that may still be quite a way off.
I have drawn a trend line connecting the 2001 low with the point 1 low. I like trend lines like these that aren't obvious. Price is now down around this support line and I expect a bounce from here.
I have added moving averages with time periods of 100 (red) and 200 (black) and they have just made a bearish crossover with the red line crossing below the black line. As often happens after these bearish events, price then rallies back up to test the averages.
I have also added Bollinger Bands and I'd like to see the rally high be rejected around the upper band.
I expect any rally to be a bear rally with price the coming back down to eventually put in the point 5 low.
And there looks to be a good chance that the point 5 low will set up triple bullish divergences on the RSI and MACD indicator. That would be a promising sign for the bulls. But alas, that may still be several years away.
And once the final bear market low is in place, price will need to go up and bust the downtrend line connecting the 2005 and 2008 highs. That would indeed be thrilling for the bulls but once again I don't see that happening anytime soon.
Summing up, this bear market still has a lot of time to play out and quite frankly it just isn't a market I have any interest being involved in. Not yet anyway.
By Austin Galt
Austin Galt is The Voodoo Analyst. I have studied charts for over 20 years and am currently a private trader. Several years ago I worked as a licensed advisor with a well known Australian stock broker. While there was an abundance of fundamental analysts, there seemed to be a dearth of technical analysts. My aim here is to provide my view of technical analysis that is both intriguing and misunderstood by many. I like to refer to it as the black magic of stock market analysis.
Email - info@thevoodooanalyst.com
© 2015 Copyright The Voodoo Analyst - All Rights Reserved
Disclaimer: The above is a matter of opinion provided for general information purposes only and is not intended as investment advice. Information and analysis above are derived from sources and utilising methods believed to be reliable, but we cannot accept responsibility for any losses you may incur as a result of this analysis. Individuals should consult with their personal financial advisors.
Austin Galt Archive |
© 2005-2022 http://www.MarketOracle.co.uk - The Market Oracle is a FREE Daily Financial Markets Analysis & Forecasting online publication.