


Stock Market Three Peaks/Domed House Part II
Stock-Markets / Stock Markets 2015 Mar 17, 2015 - 06:04 PM GMTBy: Ed_Carlson

In his 1969 brochure One Year Later: A follow-up of the Three Peaks and Domed House George Lindsay wrote that the pattern lasts roughly 2 years and 2 months from the beginning to the end of a bull market. Looking back over the 29 occurrences of the pattern in the Dow (since 1901) it can be seen that the pattern lasted significantly longer than that on just five occasions. Those bull markets that ended in 1961, 1966, 1981, 1987, and the current bull market, all endured for more than three years and concluded a Three Peaks/Domed House pattern.
Of great interest to us now is the fact that in every instance of an extended Three Peaks/Domed House pattern the advance from the basic low concluded at one of the three peaks and was followed by another advance from the low of the separating decline. The longest final advance was 396 days and the shortest was 226 days.
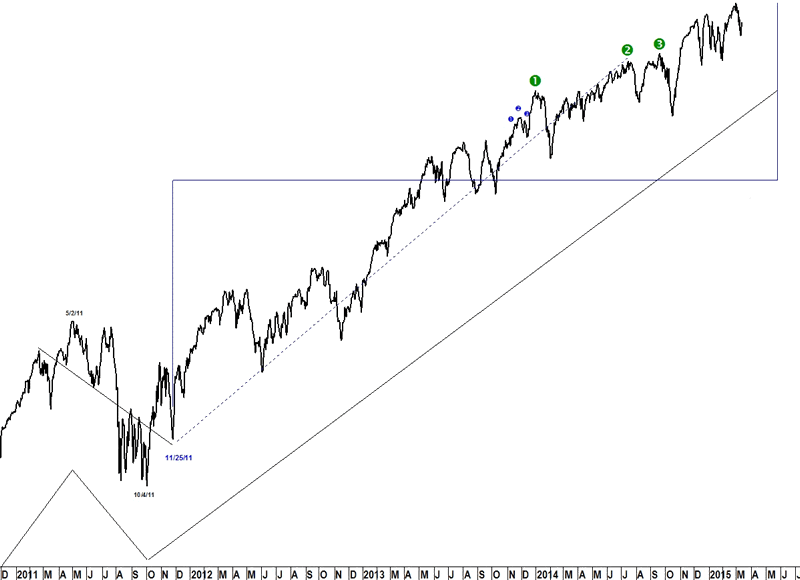
With the current bull market (from the end of the sideways movement in 2011) now more than three years old, the above observation lends confidence to the past decision to count the basic advance from the 2011 low to peak two last July.
Fractals
Another interesting observation about the current pattern is what I termed fractals (George Lindsay and the Art of Technical Analysis, FT Press 2011) or what Lindsay referred to as a minor form of the pattern. He wrote that a complete Three Peaks/Domed House pattern can often be found in one of the peaks of the larger pattern. He wrote that if the minor pattern is to appear it usually does so in peak three, however, he often used the 1946-1948 pattern as an example which contained a minor pattern in peak one.
The current major pattern contains a fractal of the Three Peaks/Domed House pattern in peak one from November 2013 to February 2014. Lindsay's rule for the pattern that the Dow always returns to the low of the Domed House warns of an outsized sell-off after the top of the pattern. The January 2014 correction was no exception to this rule.
Try a "sneak-peek" at Lindsay research (and more) at Seattle Technical Advisors.
Ed Carlson, author of George Lindsay and the Art of Technical Analysis, and his new book, George Lindsay's An Aid to Timing is an independent trader, consultant, and Chartered Market Technician (CMT) based in Seattle. Carlson manages the website Seattle Technical Advisors.com, where he publishes daily and weekly commentary. He spent twenty years as a stockbroker and holds an M.B.A. from Wichita State University.
© 2015 Copyright Ed Carlson - All Rights Reserved
Disclaimer: The above is a matter of opinion provided for general information purposes only and is not intended as investment advice. Information and analysis above are derived from sources and utilising methods believed to be reliable, but we cannot accept responsibility for any losses you may incur as a result of this analysis. Individuals should consult with their personal financial advisors.
© 2005-2022 http://www.MarketOracle.co.uk - The Market Oracle is a FREE Daily Financial Markets Analysis & Forecasting online publication.