Corn, Soybeans, Wheat Agricultural Commodities Price Forecasts
Commodities / Agricultural Commodities Jul 12, 2015 - 01:16 PM GMTBy: Austin_Galt
 The prices of agricultural commodities of corn, soybeans and wheat have all exploded higher recently. This has been expected and was laid out in analysis back in February 2015. Now that the rallies have kicked off let’s revise the technicals of all three soft commodities.
CORN
The corn price has flown higher in recent weeks and is now playing out as expected from previous analysis. Let’s revise the short term picture using the monthly chart before reacquainting ourselves of the bigger picture using the monthly chart.
CORN DAILY CHART
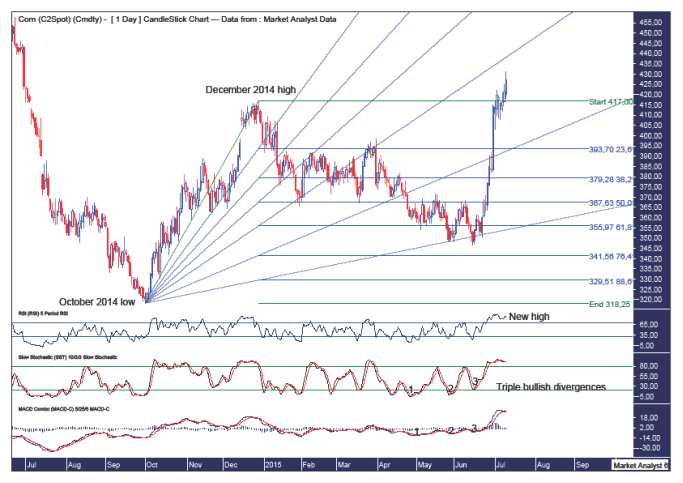
We can see the impulsive move higher since the recent June low at $346.75.
I have drawn a Fibonacci Fan from the October 2014 low to December 2014 high and in previous analysis we were looking for price to find support at this 88.6% fan angle. Nice.
I have added Fibonacci retracement levels of the move up from October 2014 low to December 2014 high. In previous analysis, we were looking for price to find support at the 76.4% level which stands at $341.56. Price couldn’t quite make it that low pulling up around $5 short. Not bad.
The RSI showed a bullish divergence at this low and has now made a new high in bullish fashion.
The Stochastic and MACD indicators both showed triple bullish divergences at the recent low so it is no surprise to see a significant rise in price take place.
Let’s now move on to the bigger picture with the monthly chart.
CORN MONTHLY CHART
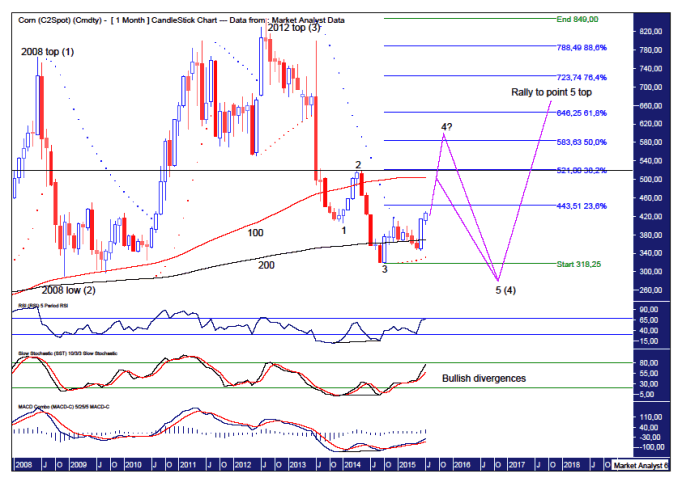
This monthly chart was shown back in February 2015.
Firstly, there looks to be a massive 5 point broadening top in play with the 2008 top point 1, the 2008 low point 2 and the 2012 top point 3. Price now appears to be tracing out its way to a point 4 low. After that low I expect a big move up to all time highs and a final point 5 high.
The way to this expected point 4 low looks to be taking one of two routes. My favoured scenario is there is a 5 point broadening low in play with points 1 to 3 already in place. Price is now headed up to put in the point 4 high before coming back down once again to put in the final point 5 low. This point 5 low would also be the point 4 low in the massive 5 point broadening top formation. Are you with me?
An alternate scenario is price puts in a lower high below the point 2 high which stands at $519.50. This is most definitely a possibility and using doing some Fibonacci calculations of the move down from point 2 high to point 3 low would help in determining where that lower high might be. While not shown the 76.4% level at $472 and the 88.6% level at $496 would be levels to watch.
The point 3 low was set in October 2014 at 318.25 and this low was accompanied by bullish divergences in the RSI, Stochastic and MACD indicators. I suspect the final low will set up triple bullish divergence. Let’s see.
If my favoured scenario plays out which is the 5 point broadening low, where is the point 4 high likely to be?
I have added Fibonacci retracement levels of the move down from 2012 top to recent point 3 low. Previously, I favoured the 61.8% level at $646 to see in the point 4 high. I think this may be stretching things a bit far and now favour price to clip the 50% level which stands at $583.
I have added moving averages with time periods of 100 (red) and 200 (black) which are in bullish order with the red line above the black line. I expect these averages to come back closer together before the move to new all time highs commences.
Finally, the PSAR retains its bullish bias with the dots providing support on the recent move down.
Summing up, price generally continues to trade as expected and we await an important major high before the move to final low commences.
SOYBEANS
The soybean price has launched higher off its low its May 2015 low of $920.50. We have been waiting for this expected rally which was laid out in analysis back in February 2015. That may seem a while but this is the monthly chart which can be hard to deal with for all the whippersnappers that find it hard to look beyond a few days.
Let’s review the technicals using the daily and monthly charts.
SOYBEANS DAILY CHART
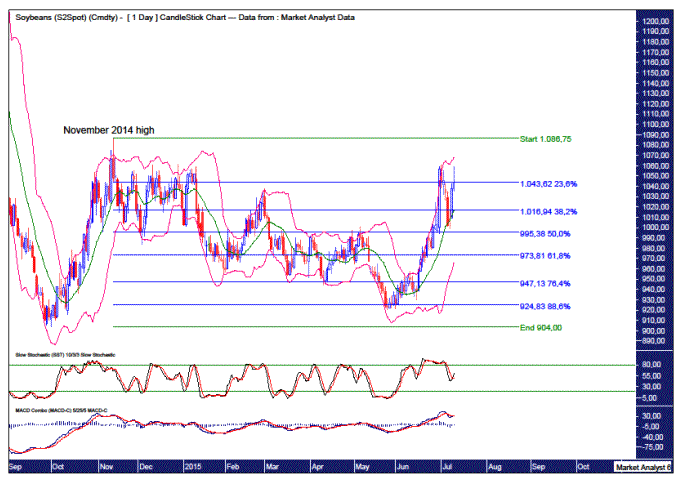
We can see price rose from its low up to the November 2014 high in impulsive fashion. Since then the price action has been quite unremarkable. Boring even. The move up into that November 2014 high took around one and a half months while it has taken around 6 months correcting. Just that fact is often a sign that the trend is up.
I have added Fibonacci retracement levels of that first move higher and the recent low was right around the 88.6% level so it was a deep retracement which is common for the first correction in a new bull trend.
The Bollinger Bands show price clinging to the upper band in its most recent impulsive move higher. Price has just found support at the middle band and looks to be heading back to the upper band to go on with the job.
The Stochastic indicator has just turned bullish while the MACD indicator looks to be threatening to do the same.
Where is price likely to rally to? Let’s go to the monthly chart to try and answer that question.
SOYBEANS MONTHLY CHART
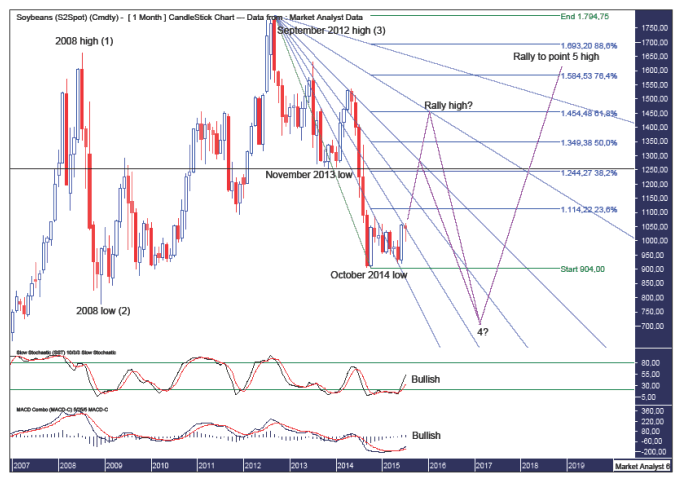
The Stochastic and MACD indicators have both made recent bullish crossovers and things look good from a bullish perspective.
I have drawn a Fibonacci Fan from the September 2012 high to October 2014 low. We can see the recent test was around support from the 23.6% angle. Price is now challenging the 38.2% angle and has found initial resistance. I expect price to bust through imminently.
As for how high the rally will trade, there are two angles that look good to the eye. The first is the 61.8% angle while I personally favour an even bigger rally up to the 76.4% angle.
I have added Fibonacci retracement levels of the move down from September 2012 high to October 2014 low and I favour a final rally high up around the 61.8% level which stands at $1454. A weaker rally will mean the 38.2% level at $1244 is one to watch.
I have drawn a horizontal line denoting the November 2013 low at $1255. This should act as resistance and this level is my minimum expectation for price. I expect price to trade above this level as it gives the resistance a thorough test. The only question I have is how thorough will that test be.
Finally, there looks to be a massive 5 point broadening top in play with the 2008 high point 1, the 2008 low point 2, and the 2012 high point 3. I think price is still tracing itself out on its way to a point 4 low. Once that low is in place in the coming years then price should explode to new all time highs and a final point 5 high.
Summing up, it is now rally time and there looks to be plenty more fun to be had for the bulls before the bear bites back.
WHEAT
The wheat has price exploded off its recent lows so let’s revise the situation using the daily and monthly charts.
WHEAT DAILY CHART
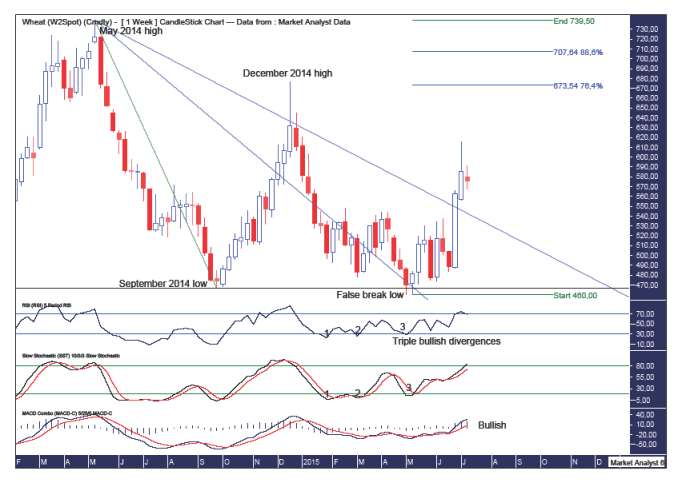
I have drawn a horizontal line denoting the September 2014 low at $466.25. Price recently nudged below that level in May 2015 before reversing back up and creating a false break low at $460 in the process.
I have drawn tow Fibonacci Fan angles from the May 2014 high. The low was right around 61.8% fan angle. Price has subsequently traded above the 76.4% angle in bullish fashion. This angle had previously provided solid resistance around the December 2014 high.
The recent low was accompanied by triple bullish divergences in the RSI and Stochastic indicator while the MACD indicator also showed a bullish divergence and is now looking very bullish.
As laid out in previous analysis, I favour price trading above the December 2014 high which stands at $677. I now also favour price taking out the May 2014 high at $739.50. However, if I am wrong about this then there are a couple of levels to watch closely. What are they?
I have added a couple of Fibonacci retracement levels of the move down from May 2014 high to September 2014 low. The 76.4% level stands at $673 which is right around the December 2014 high while the 88.6% level at $707 is just above.
Personally, I favour even higher so let’s go to the monthly chart to see where some likely rally highs levels are.
WHEAT MONTHLY CHART
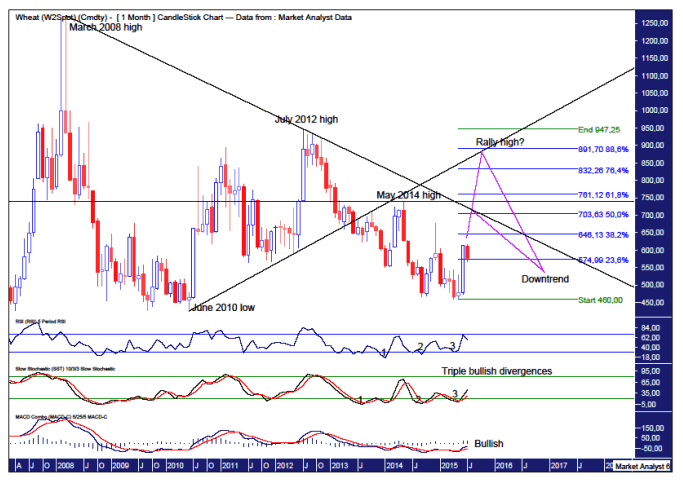
I showed this chart back in February 2015 and the rally has finally appeared. In that analysis, I was looking for price to find resistance and turn back down after hitting the downtrend line I have drawn connecting the March 2008 and July 2012 highs. It still may however I am starting to favour an even bigger parabolic rally that gets up to resistance from the uptrend line I have drawn from the June 2010 low.
I have added Fibonacci retracement levels for the move down from June 2012 to the recent low. Price turning down at the downtrend line would likely see the 50% level at $703 come into play. Personally, I favour price trading up to at least the 76.4% level at $832 which would mean price finding resistance from the uptrend line.
I have drawn a horizontal line denoting the May 2014 high at $739.50 and price trading above that means the parabolic rally scenario is playing out.
Price trading above the June 2012 high at $947 would likely mean the next big uptrend is taking place but that is not my expectation.
The recent price low was accompanied by triple bullish divergences on the RSI and Stochastic indicator. This often leads to a significant rise and this is the monthly chart so it’s a pretty solid indication.
The MACD indicator showed a bullish divergence and is now trending up and looking bullish.
Summing up, the expected rally is finally taking place and the only question is how parabolic does this rally trade. I favour a lot but time will be the judge.
By Austin Galt
Austin Galt is The Voodoo Analyst. I have studied charts for over 20 years and am currently a private trader. Several years ago I worked as a licensed advisor with a well known Australian stock broker. While there was an abundance of fundamental analysts, there seemed to be a dearth of technical analysts. My aim here is to provide my view of technical analysis that is both intriguing and misunderstood by many. I like to refer to it as the black magic of stock market analysis.
Email - info@thevoodooanalyst.com
© 2015 Copyright The Voodoo Analyst - All Rights Reserved
Disclaimer: The above is a matter of opinion provided for general information purposes only and is not intended as investment advice. Information and analysis above are derived from sources and utilising methods believed to be reliable, but we cannot accept responsibility for any losses you may incur as a result of this analysis. Individuals should consult with their personal financial advisors.
Austin Galt Archive |
© 2005-2022 http://www.MarketOracle.co.uk - The Market Oracle is a FREE Daily Financial Markets Analysis & Forecasting online publication.


