


Why Commodities And Precious Metals Are True Contrarian Opportunities
Commodities / Commodities Trading Sep 14, 2015 - 10:09 AM GMTBy: SecularInvestor

 Investors tend to make ‘contrarian’ investing choices too early in the cycle.
Basically, the price of an asset can be trending higher, lower or sideways. When an asset is declining in price, it remains in a downtrend until proven otherwise. The chance of a trend change is much smaller than the trend continuing. In other words, being ‘contrarian’ is difficult, and the pitfall is that an investor may be too early with his contrarian call.
Our experience shows that a good contrarian call is based on a set of indicators, including price and technicals, investor and media sentiment, and opportunity costs. More extreme indicators show the market is closer to the turning point. In our view, commodities and precious metals are very close to that point. Let us review our 3 indicators.
For price and technicals, we use the CRB index, a proxy for the commodities complex. Note that petroleum has a large weight in this index. As the two decade chart reveals, the CRB index touched the 1999 and 2001 lows in August of this year during a panic sell off. The CRB is trading 58% lower than its 2009 highs, while it is down 48% from its 2011 highs. These are huge corrections.
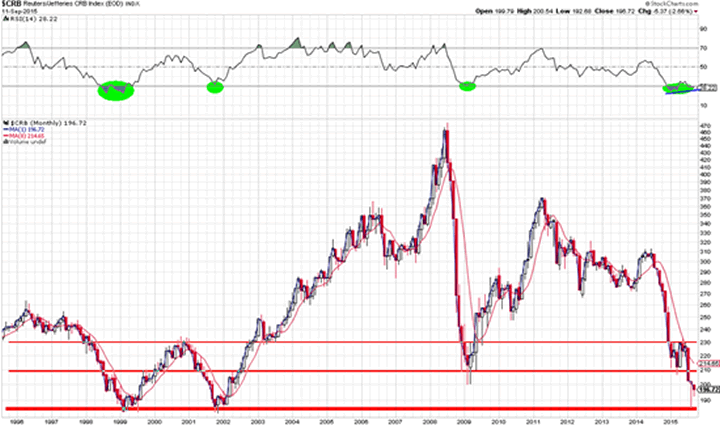
Source: Stock Charts
Moreover, from a technical point of view, we are going through a beautiful divergence between momentum and price, as indicated with the blue line in the far right green oval on the chart above. This has occurred after a drop into deeply oversold levels. Technically, this is a true contrarian opportunity.
Regarding precious metals, it is clear that $1,000 /oz will offer formidable technical and psychological support (no chart required to make that point). Given our focus on secular trends, we remain convinced that the peak of the previous secular cycle is the absolute bottom of the current cycle. Gold touched $1,075 /oz in July/August of this year, which is still 18% above the 1980 top, but there is little room left, given the current 45% correction in this cycle.
Our second indicator is investor sentiment, combined with media sentiment. Let’s address investor sentiment first. Similar patterns exist on the sentiment chart and on the price chart. The next chart shows the Optimism Index (Optix) from Sentimentrader for the CRB index. Optimism is currently at all-time lows, similar to 1998 and 2001. These levels were deep bottoms in the past and contrarian calls at those bottoms were excellent choices.
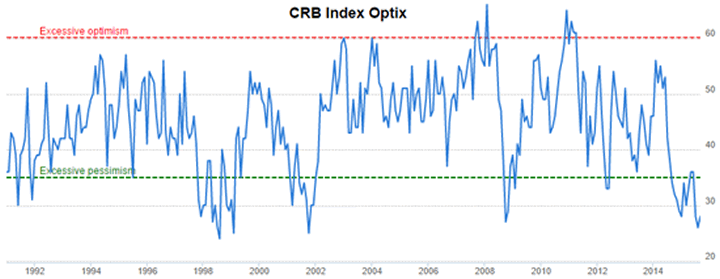
Source: Sentimentrader
The media sentiment is confirming the extremes we observe in market sentiment. Consider the following two cases which illustrate our point.
First, a month and a half ago, mainstream media jumped on a 3-year old report by two professors who predicted that gold would fall to $350 /oz. The report appeared in 2012, and attracted media attention on July 27th of this year (see google), exactly the day when gold dropped to its lowest price in five years. That day was not chosen accidentally by the large media outlets; it proves their ultra-bearish sentiment. Let’s face it, with gold’s production cost above $1,000 /oz and gold’s previous secular top at $850 /oz, that target of $350 /oz does not make sense.
The second example is another ‘over-the-top’ prediction for crude oil. Goldman Sachs (GS) warned yesterday, September 11th, that crude could fall to $20 /barrel (source). GS mainly cites supply/demand reasons for their call. Those could be true, but do not forget that crude oil at $20 /barrel will destroy oil producers around the world which OPEC would never accept.While the production cost of crude oil is not clear , we believe it is not much lower than $40 /barrel. Coincidentally, that price is also the top of the previous secular cycle in crude oil, reached in 1980, similar to the gold cycle.
Mainstream media outlets are happy to report how low commodities will go, even after such a steep decline. Prices are becoming extremely low. In markets the higher the confidence that an asset ‘has to go’ in one direction, the closer the point that the opposite will occur.
The third indicator in our assessment is the opportunity cost. Which other assets are more attractive to investors than commodities and precious metals? The relevant investment opportunities are stocks and bonds. Regarding bonds, the much hyped but not realized aspiration to raise rates will not be beneficial to bond holders. Over the course of this year, the market has already forced Treasury yields higher, even in the light of the lowest Federal Funds Rate ever (see next chart). The attractiveness of bonds is stagnating and likely to decline.
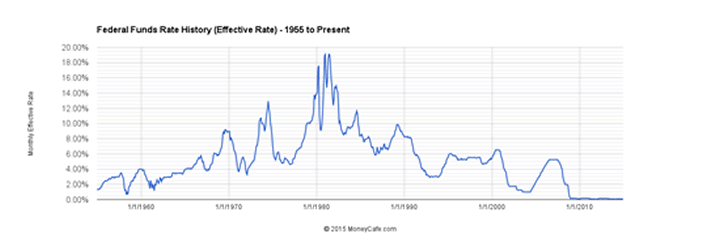
Source: Money Cafe
The other opportunity cost is stock market investing, another key point. Stocks have been attractive in the last several years, but their rate of return cannot continue at the same pace. Annual returns in the last three years have been 15%, 32%, 13% respectively in 2012, 2013, 2014. Double digit returns over four consecutive years have only occurred twice since WWII (in 1952 and 1999). Chances are high that the attractiveness of stocks is diminishing, allowing for capital to move to the deeply oversold commodity space.
Our conclusion is that we have reached extremes in the three contrarian indicators for commodity and precious metals investing. However, a segment that has been sold as hard as commodities and metals will not turn into a raging bull market as soon as the downtrend stops. Rather, we anticipate a gradual recovery. Contrarian investors are shopping quality names in the commodity space, with high discounts. Maybe you should consider this as well?
Secular Investor offers a fresh look at investing. We analyze long lasting cycles, coupled with a collection of strategic investments and concrete tips for different types of assets. The methods and strategies are transformed into the Gold & Silver Report and the Commodity Report.
Follow us on Facebook ;@SecularInvestor [NEW] and Twitter ;@SecularInvest
© 2015 Copyright Secular Investor - All Rights Reserved Disclaimer: The above is a matter of opinion provided for general information purposes only and is not intended as investment advice. Information and analysis above are derived from sources and utilising methods believed to be reliable, but we cannot accept responsibility for any losses you may incur as a result of this analysis. Individuals should consult with their personal financial advisors.
© 2005-2022 http://www.MarketOracle.co.uk - The Market Oracle is a FREE Daily Financial Markets Analysis & Forecasting online publication.