


Longer Cycles for Gold and the US Dollar
Commodities / Gold and Silver Stocks 2018 Jan 01, 2018 - 02:29 PM GMTBy: SurfCity

 By now you know that my swing trading approach is to focus on the 5-6 Month Intermediate Cycle Low (ICL) to establish positions. It seem’s that everything that I track has the 5-6 month low to low cycle. Sometimes the ICLs come sooner at 4 months or later at 7+ months but the average is 5-6 months.
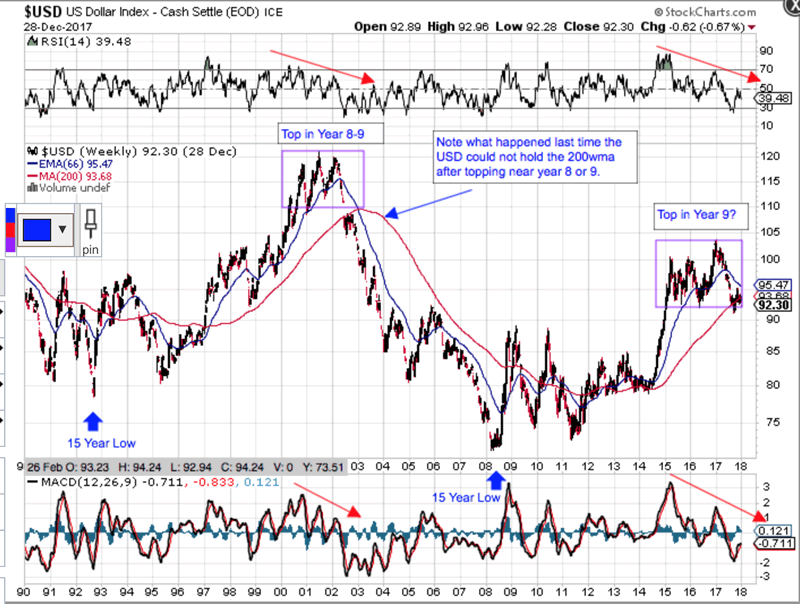
Everything also has a Yearly Cycle Low (YCL) which is nothing more than two 5-6 mont ICLs. Cycles longer than one year, however, vary by asset. The USD and Bonds have a 3 Year Cycle low to low and Stocks have a 7 Year Cycle low to low. Gold’s longer Cycles include a 4 Year Cycle and an 8 Year Cycle, which is simply two 4 Year Cycles back to back. Remember that longer cycles typically dominate shorter ones, meaning that if the longer cycle is in a bullish phase, most of its 5-6 month Intermediate Cycles will be right translated in terms of Time while making a higher high and a higher low (i.e. stair stepping up so to speak).
My first chart is a 28 year Gold weekly that shows Gold’s 8 Year Cycle pattern using the Purple Cycle tool on StockCharts. Cycles, however, are not exact, in terms of Time so I have added my Blue Arrows showing you that I believe Gold’s last 8 Year Cycle low came in early 2016 closer to the 7 year mark. The chart also shows a Blue Fork, that while not technically correct (handle does not attach), it does show you the long term Price channel I am tracking out of the 2001 low.
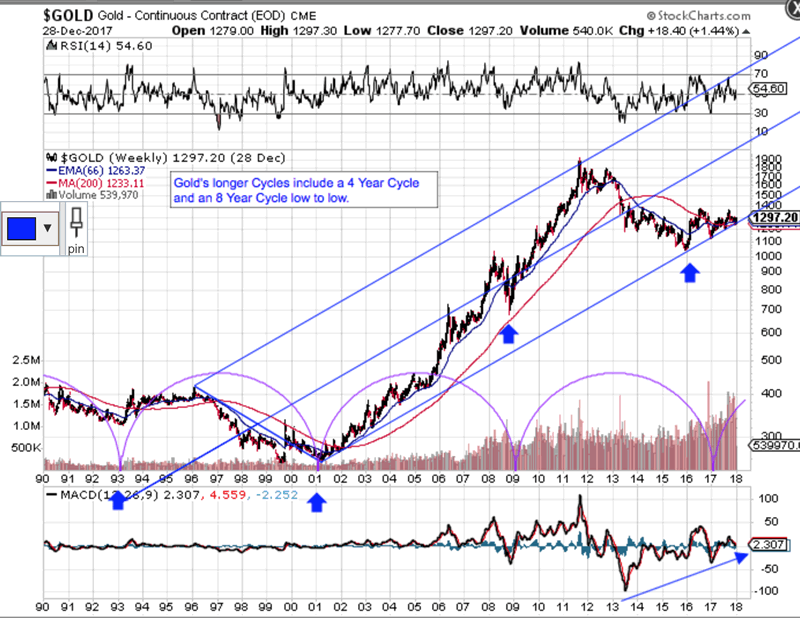
Why is this important? If Gold’s 8 year low to low pattern holds, the next one should be in the 2024 time frame. I also believe the USD’s longer 15 year Super Cycle has topped in Year 9 in early 2017. If correct, we should see downside price action in the USD for another 5 years, give or take a year. While the inverse correlation for the USD and Gold does not always hold, my expectations are that it will for much of the next 4-5 years as the USD moves into its longer term 15 year low. If correct, my expectations are that Gold will easily take out its previous high from 2011.
By Surf City
Everything about Cycle Investing
© 2017 Surf City - All Rights Reserved
Disclaimer: The above is a matter of opinion provided for general information purposes only and is not intended as investment advice. Information and analysis above are derived from sources and utilising methods believed to be reliable, but we cannot accept responsibility for any losses you may incur as a result of this analysis. Individuals should consult with their personal financial advisors.
© 2005-2022 http://www.MarketOracle.co.uk - The Market Oracle is a FREE Daily Financial Markets Analysis & Forecasting online publication.