Here’s What Historically Happens to Stocks When Bull Markets End
Stock-Markets / Stock Markets 2018 Jan 18, 2018 - 01:59 AM GMTBy: GoldSilver
You undoubtedly know that 2017 was a record-setting year for the broad stock markets. And while gold was up last year despite numerous headwinds, most mainstream investors aren’t paying much attention to gold since they keep seeing so much green in their stock portfolios.
Even I was taken back by some of the data from the bull market in stocks…
-
The Dow hit a record high 71 times last year. On average, a new high was hit more frequently than once a week.
-
For the first time ever in its almost 90-year history, the S&P 500 rose every month in 2017. And historically there have only been four years with gains in 11 months of the year.
-
The S&P’s largest pullback in 2017 was 2.8%, the smallest since 1995.
-
To start 2018, the S&P 500 has risen in each of the five trading sessions, hitting a new record high every day. The last time the index opened the year with at least five straight record highs was 1964.
-
And as Mike pointed out in his 2018 predictions, the CAPE (Cyclically Adjusted Price-Earnings) ratio has now matched its 1999 level, the second highest reading in over 100 years of data. The CAPE now has a higher reading only in 1929.
This all begs the question: is the bull market about to come to an end? This is exactly the kind of frothy behavior a market sees near its apex, so it’s definitely a prudent question to ask. If last year ends up being the top of this bull market, what does history say could happen to stocks this year?
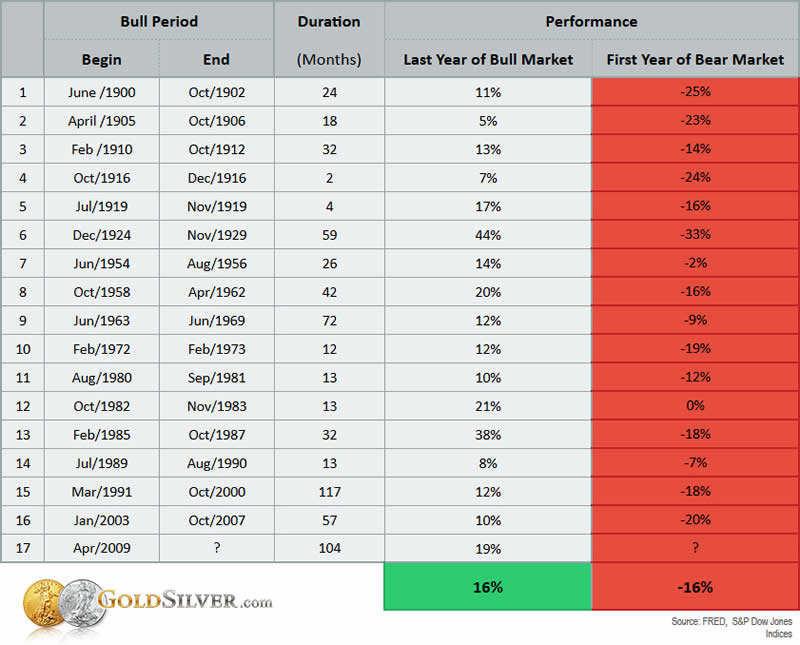
We dug up the data for all bull markets in the S&P since the year 1900, and then examined what happened in the very first year after each of those bull markets ended. In other words, what did the first year of the bear market look like after the last full year of the bull market? This could be useful data, if 2017 ends up being the peak of the bull market.
Here’s what history shows.
First Year Performance of Bear Market After Bull Market Ends

While the declines for the first year of the bear market varied greatly, you can see that on average, the S&P lost 16% the year immediately following the last year of the bull market. Also notice that in only four cases was the decline measured in single digits—all others were double digit losses.
Mike Maloney believes this is the year overvalued stocks begin their descent. If he’s right, the decline could be higher than the historical average, since this is the second longest bull market in history.
And what is gold likely to do in that environment? We’ve shown before that gold has acted as a buffer—and gained ground—in most of the biggest stock market crashes.
The bottom line for us is that we think a major shift is coming, not just in overpriced stock and bond and real estate markets, but in the currencies that have been abused by many central bankers the world over. Once the process gets underway, the mainstream will turn back to mankind’s oldest form of money in mass, and our patience and forethought will pay off.
Mike and I continue to buy physical gold and silver. If you’d like to follow our lead, you can pre-order 2018 gold Eagles and silver Eagles now, with both estimated to ship on January 19.
Source: https://goldsilver.com/blog/what-happens-to-stocks-when-bull-markets-end/
© 2018 Copyright GoldSilver - All Rights Reserved Disclaimer: The above is a matter of opinion provided for general information purposes only and is not intended as investment advice. Information and analysis above are derived from sources and utilising methods believed to be reliable, but we cannot accept responsibility for any losses you may incur as a result of this analysis. Individuals should consult with their personal financial advisors.
© 2005-2022 http://www.MarketOracle.co.uk - The Market Oracle is a FREE Daily Financial Markets Analysis & Forecasting online publication.


