The Interest Rates Are What Matter In This Market
Stock-Markets / Financial Markets 2018 Jan 18, 2018 - 05:13 PM GMTBy: WMA
 The “Trump rally” in U.S. stocks has gone ballistic. Even the most bullish of the bulls did not expect this. A couple weeks ago, bank strategists were forecasting a 2018 year-end target on the S&P 500 at 2850. After the first two weeks of the New Year the index is already closing in on this timid 2018 target price.
Many are saying that the equity rally is due to the tax cuts. We disagree. The tax cuts added fuel to the fire, but if markets are still efficient, the tax cut news should have been priced in last year. Deregulation may continue benefiting the financial sector in particular, but again the broad equity market should not continue to rally on known news. The only reason equity markets have jumped again in the past weeks is momentum – nothing has changed in 2018 (other than perhaps sentiment as people become believers in the unending equity rally). What does matter is the rates environment (plural) – (1) interest rates and (2) the inflation rate. We’ll be looking in this Commentary at where these rates may be headed and levels at which a change in these rates may matter for risk assets.
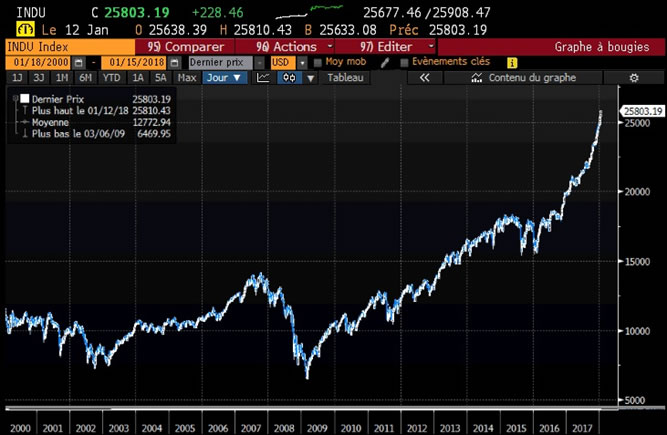
As of last Friday’s close, the rally on the Dow Jones Industrial Average off Brexit lows has now matched the entire bear market encompassing the Great Recession of 2007-2009. Whiles the rates environment is different this cycle (thanks to central banks), buying risk asset on the belief that “this time it’s different” and that price will stay aloft should prove painful for passive index investors.
Inflation Rate
We’ve been told by the Federal Reserve and by government statistical data that there has been essentially no inflation for the past decade. While inflation has mostly been contained to financial asset prices, 2018 will likely see the official measures of inflation finally tick higher. Among the forces coalescing to propel prices higher are:
- the strongest domestic and international economies since the start of the decade,
- the lowest unemployment rate in 17 years,
- oil’s return above $70 a barrel,
- a softening U.S. dollar and still-easy monetary policies around the world,
- the Republican tax cut which is injecting more money into the economy (many American companies, most notably Wal-mart, are already passing tax savings on to employees),
- about 20 U.S. states from Florida to Washington began 2018 by raising their minimum wages
If the above factors don’t lift the CPI (consumer price index) and PCE (personal consumption expenditures) we’ll need to call for a Congressional Inquiry into the dealings of the Bureau of Economic Analysis.
We foresee the PCE moving above the Fed’s sacred 2% target this year. The question is whether or not the Fed will let the economy run hot and allow inflation to stay above 2% y/y for some period. Remember the Fed is notorious for being behind the curve during periods of economic transition…and blowing asset bubbles!
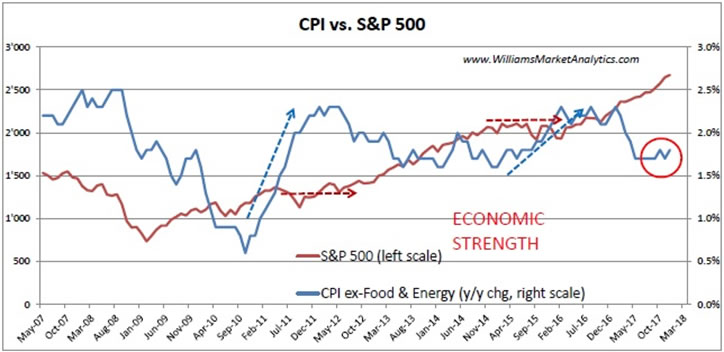
Looking at the Core Consumer Price Index (CPI, ex-food & energy prices) versus the S&P 500 in our chart below, we see that in periods of rising inflationary pressure (blue curve) the S&P 500 has stalled out. The latest core CPI reading (+1.8% y/y in December) maybe indicating inflation is again picking up. If so, the S&P 500 may, at the very least, stall out in the coming months.
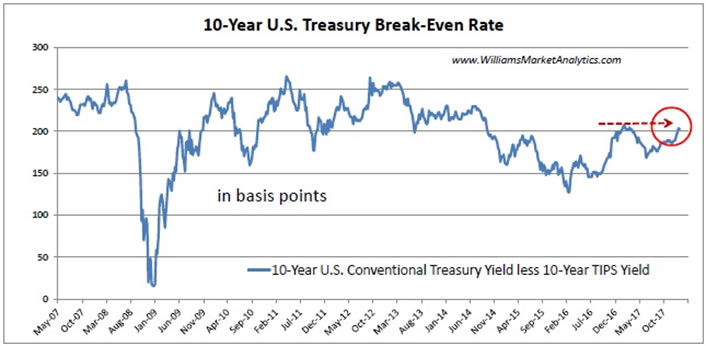
What is the bond market saying about inflation? The 10-year U.S. Treasury break-even inflation rate is now above 2%. Recall that the breakeven rate is the difference between a conventional U.S. Treasury bond yield and the equivalent maturity TIPS bond. The bond market has a better track record of sniffing out future inflation than the Federal Reserve forecasts.
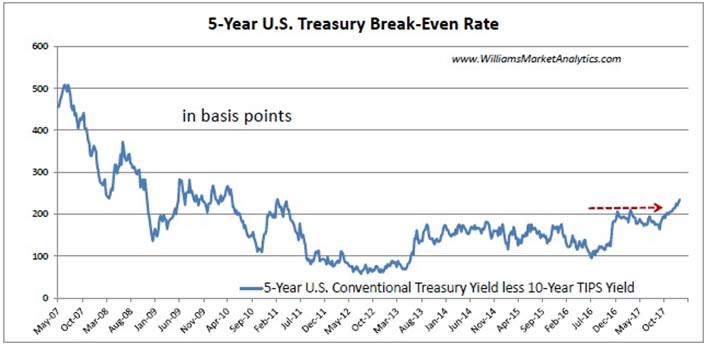
The 5-year U.S. Treasury break-even inflation rate is nearing 240 basis points. We believe breakeven rates are the best indicators of future inflation. And according to the bond market, we should be expecting inflation.
Interest Rates
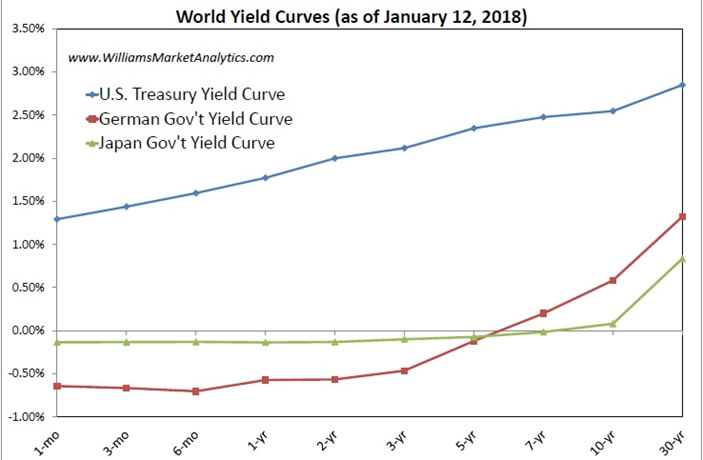
We know that since 2009, besides pulling down the short end of the yield curve with 0% Fed Funds or discount rates, world central banks have been aggressively printing money to buy longer-dated bonds to suppress yields on the long end of the yield curve as well. The U.S. yield curve remains positively sloped (in blue below), while the German and Japanese yield curves are essentially flat (except at the very long maturities). Yes, we still need to go out to SIX YEARS to see positive nominal yields in Germany, red line below (eight years in Japan, green line).
One thing is clear from the yield curves below: central banks are incapable of normalizing policy rates. Bringing up rates anywhere near where policy rates have historically been nine years into an expansion would likely invert all these yield curves. Central banksters, who have become accustomed to playing God with the economy, believe that in preventing an inversion of the yield curves that they can indefinitely forestall the next recession. So far the central banks are succeeding, but we know that permanent manipulation of the yield curve is not a cure for recession but rather a recipe for a future financial crisis.
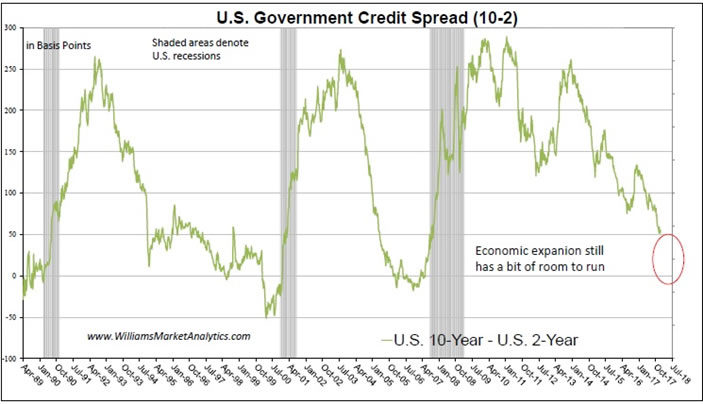
Looking at the U.S. 10-year/2-year yield curve (2-year rates are a bit more influenced by markets than central banks), we can see that the bond traders are working to flatten this curve. Despite official interest rate manipulation, we believe that when/if the 10/2 curve inverts (50 basis points to go) the next recession will begin within the following months. The economic expansion still has a bit more life.
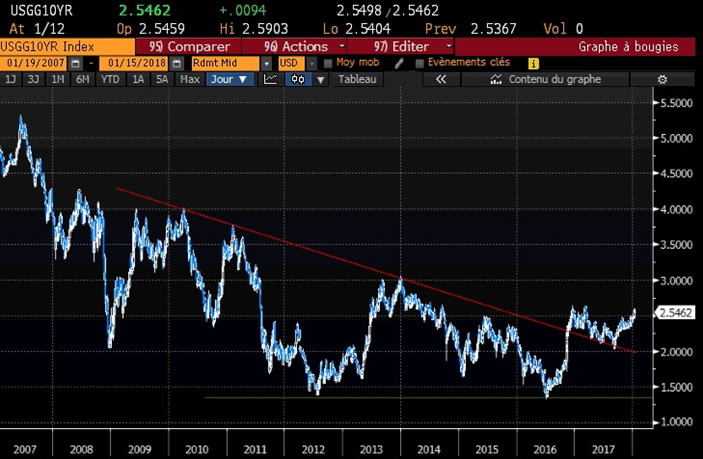
The curve flattening has persisted despite 10s have tentatively having put in a multi-year double top (2012 and 2016)…perhaps presaging a major change in trend (Bill Gross just proclaimed, again, the end of the 30-year long bull market in bonds). This implies that 2s have been rising even faster recently, suggesting that the bond market does not agree with the Fed’s low policy rate. The post-GFC down-trend in 10-year rates (red line) has been broken, for the time-being. Getting above 2.64% will put the next piece of the puzzle in place. Rising rates can only be a headwind for the economy and risk assets.
Conclusion
We remain in a very late-cycle economic expansion. U.S. fiscal policy stimulus (tax cuts, infrastructure spending, deregulation) will breathe new life into the U.S. economic expansion which should survive until 2019. Rising inflation and rates should characterize the markets in 2018. We recommend reflation trades going forward, including commodities, natural resource company stocks, and infrastructure companies (see the WMA Roads, Bridges, & Water Index tracker).
By Williams Market Analytics
http://www.williamsmarketanalytics.com
We provide insightful market analysis and account management founded upon our very successful systematic, disciplined approach to investing. Our investment analysis revolves around two inputs: company valuation and our quantitative, market-based indicators. Learn more about our approach and our strategist.
© 2018 Copyright Williams Market Analytics - All Rights Reserved
Disclaimer: The above is a matter of opinion provided for general information purposes only and is not intended as investment advice. Information and analysis above are derived from sources and utilising methods believed to be reliable, but we cannot accept responsibility for any losses you may incur as a result of this analysis. Individuals should consult with their personal financial advisors.
© 2005-2022 http://www.MarketOracle.co.uk - The Market Oracle is a FREE Daily Financial Markets Analysis & Forecasting online publication.


