5 Maps And Charts That Predict Geopolitical Trends In 2018
Politics / GeoPolitics Jan 19, 2018 - 10:28 AM GMTBy: John_Mauldin
5 Maps And Charts That Predict Geopolitical Trends In 2018
 BY JACOB SHAPIRO : Almost a year ago to the day, we wrote an article titled "The Geopolitics of 2017 in Four Maps." As it turned out, that article was one of our most popular in 2017.
We return this year with a similar concept in mind. Here are some of our best charts and maps from the past year, with an explanation of why each graphic is crucial for understanding the geopolitical forces to watch in the year ahead.
Let’s dive in.
Map #1: The Coming Conflict Between China and Japan
Source: Geopolitical Futures
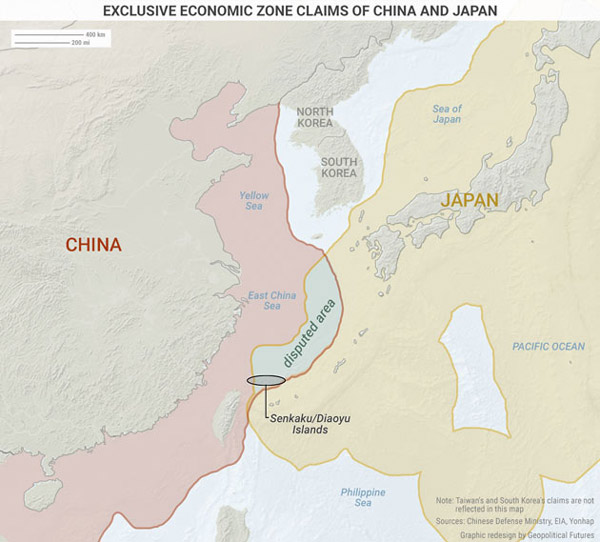
This year, the focus in East Asia will shift from the back-and-forth threats between Kim Jong-un and US President Donald Trump to the Sino-Japanese relationship.
China and Japan’s relationship has remained steady for many decades, and with good reason. After all, they have many economic interests in common. But a nuclear North Korea changes the game.
It would signal to Japan that a US security guarantee is perhaps not worth what it once was—and that means Japan will become more aggressive in pursuing its own interests. It would signal to China that the US is all bark and no bite, and that Trump is a paper tiger.
In 2017, Xi Jinping became the newest dictator in China, and Shinzo Abe pulled off a stunning electoral comeback in Japan, cementing his mandate for years to come. They are two powerful leaders of two powerful countries with a history of mutual mistrust and a hunch that the US is too self-absorbed to throw its weight around in the region the way it used to.
That means China and Japan will begin competing with each other directly—on the Korean Peninsula, in Southeast Asia, and as shown above, in areas they both claim for themselves.
Map 2: Persia Rises
Source: Geopolitical Futures
The Middle East in 2017 was all about the war against the Islamic State.
It created strange bedfellows. Russia coordinated its military activities with the United States. The cooperation between Turkey and Iran, historical rivals, was unprecedented. The Arab states put aside their differences and their disdain for the Bashar Assad regime and devoted their resources to the Islamic State’s defeat.
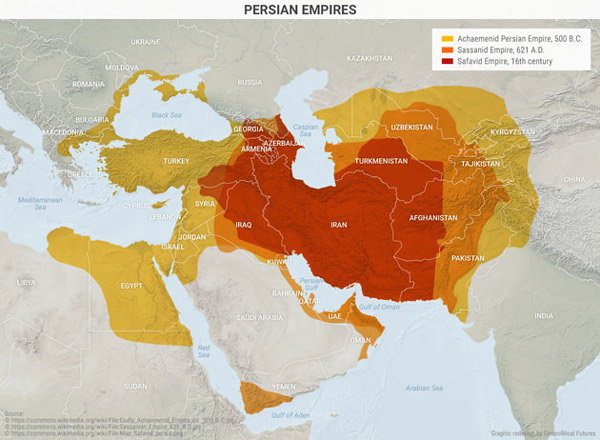
As it turned out, the war was successful. IS no longer holds meaningful territory in the Middle East—just a few isolated pockets in Syria and Iraq. The victor of this war was Iran, which is poised to be the most consequential actor in the region in 2018.
As the map above shows, Iran has at various times been powerful enough to dominate the Middle East. The Islamic State’s defeat is Iran’s best chance to realize its regional ambitions.
Everything is set up well for Iran. Its influence over its old nemesis Iraq has become quite strong. The preservation of the Assad regime means the preservation of one of Iran’s most powerful allies.
The end of the war against IS means Hezbollah can retreat from the battlefield and get back to ruling Lebanon… and causing problems for Israel. And all of this means Iran’s dream of projecting power out to the Mediterranean is within its grasp.
We don’t expect Iran to complete its objectives.
First of all, Iran’s geography makes power projection difficult, even with significant allies in the region. But second and more important, Turkey is stronger than Iran.
However, Turkey is not yet ready to assert that strength. That means 2018 will belong to Iran. It must make its moves now if it is to press its advantage successfully. In the long term, a new Persian empire will fail to materialize.
But in 2018, Iran’s pursuit of an empire will define Middle Eastern affairs.
Chart 3: Oil’s Glass Ceiling
Source: Geopolitical Futures
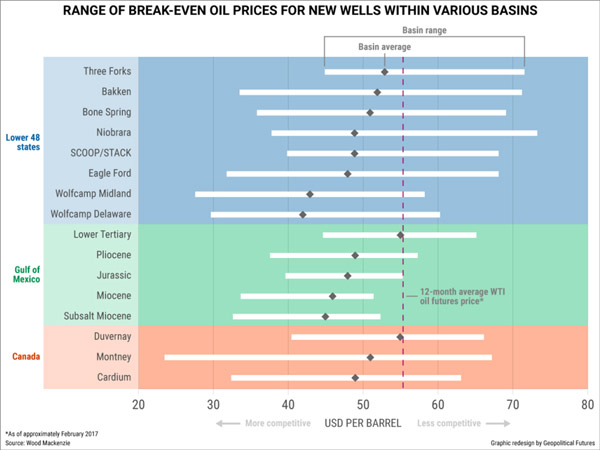
This chart shows the range of break-even oil prices for new wells in the US Lower 48, the Gulf of Mexico, and Canada. For many of these wells, the break-even point has dipped well below $60 a barrel.
And that means 2018 is going to be another year of oil prices that are too low to solve the fundamental problems of Iran, Saudi Arabia, and Russia in particular.
At the time of writing, oil prices have actually spiked to near $70. There are a host of reasons for this: cold weather, political uncertainty, and an unexpectedly large decline in US crude stocks.
The thing to keep in mind is that even with many OPEC nations respecting crude production cuts, supply will outweigh demand in 2018.
For Iran, that means less money to spend on its adventurism abroad. For Saudi Arabia, it means more political upheaval as the young, new crown prince attempts to do what no Saudi ruler before him has been able to do: make Saudi Arabia more than an artificial state held together by oil profits.
For Russia, it means a choice between cutting social spending, cutting defense spending, or running its economy into the ground (none of which are particularly savory options from Moscow’s point of view).
Absent a major event that knocks out one of the main crude producers—and we don’t see such an event happening in 2018—we expect oil prices to remain around the $60 range, perhaps even slightly lower.
We can’t predict the exact price, but we can predict continued problems for oil-dependent states as well as record-high levels of US production.
Map 4: Shuffling Deck Chairs on Europe
Source: Geopolitical Futures
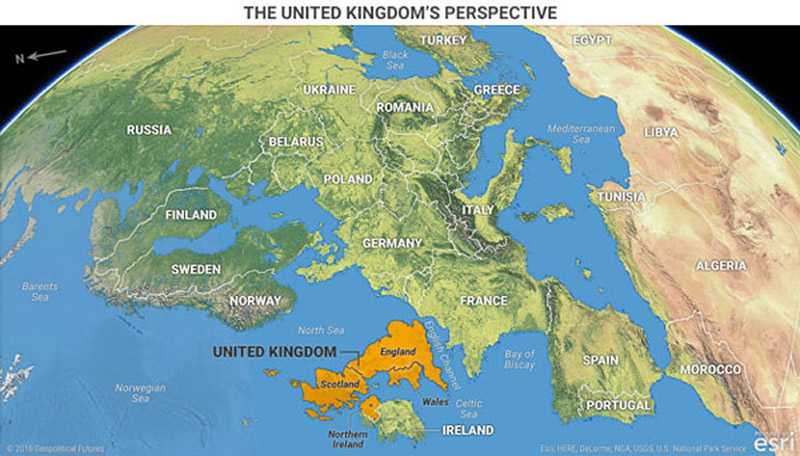
Perspective maps are my favorite kind of maps that we make. Even the subtlest change in perspective can completely alter the way you view a situation. This map of Europe from the United Kingdom’s perspective is a case in point. It also happens to highlight some of the issues we expect to dominate European affairs in the year ahead.
The UK is going to leave the European Union in 2019. 2018 will feature a great deal of political melodrama as negotiations between the EU and UK occupy headlines. But the headlines will not capture the issues of real importance.
What matters is not whether there will be a UK-EU trade deal. We expect there will be simply because the EU (i.e., Germany) trades a lot with the UK, and the UK in turn trades a lot with the EU. It is in neither side’s interests to fail to reach an agreement.
But the UK’s exit means London’s foreign policy toward Europe must now revert to a prior form. We’ve already seen the beginnings of this process with the recently signed Polish-UK defense treaty.
What’s the goal for the UK? To ensure that no country on the European continent becomes strong enough to project power across the English Channel.
Another intriguing element of this map is that at its center are two countries whose relationship, more than any other, will define EU affairs in 2018: Poland and Germany.
Poland is fed up with Germany’s disproportionate influence in the EU and is nervous about what losing the UK, a counterbalancing force to Germany within the bloc, will mean.
The EU will be tested in several areas, and separatism won’t go away, but the Polish-German disagreement on the EU’s future will be the most important issue to watch.
Chart 5: NAFTA’s Resilience
Source: Geopolitical Futures
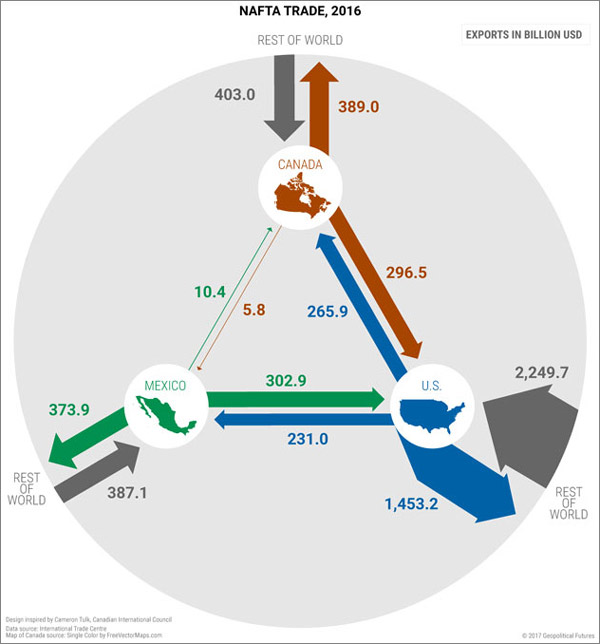
NAFTA negotiations are heating up so much that even Canada is becoming a tough negotiator. Jokes aside, one of GPF’s major forecasts for 2018 is that NAFTA will remain in place, despite whatever threats are bandied about or whatever letters of intent Trump signs. This chart goes a long way toward explaining why.
The only way we know to analyze highly politicized debates like the one surrounding NAFTA is to tune out the rhetoric. Interests take precedence over words and politics. And the interests here—for all three countries—require that NAFTA stay in place. The chart shows very clearly why this is the case for Canada and Mexico—trade with the US is an overwhelmingly important part of their economies.
But the chart doesn’t quite say everything about the US angle. US trade with NAFTA partners is large, but it doesn’t come close to US trade volumes with the rest of the world.
We can’t forget, though, that the US is made up of 50 states, and two of the most influential of those states—California and Texas—are deeply invested in NAFTA’s continued existence. And California and Texas are by no means the only states whose economies rely on trade with NAFTA partners.
As with the Brexit-EU negotiations, expect a good deal of political soap opera performances around NAFTA, especially on the question of whether Trump will try to take the US out of the trade pact unilaterally (a step that is as likely to lead to years of domestic litigation as it is to an actual US exit).
Expect also that at the end of the day, NAFTA will remain in place, no matter how badly the three sides insult each other.
Top Stories This Year
These are some of GPF’s best maps and charts of 2017, and each sheds light on what will be the important stories in 2018.
China and Japan will compete for power in Asia. Iran will try to reshape the Middle East to suit its interests. Oil prices will remain too low for Iran’s, Saudi Arabia’s, and Russia’s liking.
Poland and Germany will square off over who gets to make the rules in Brussels, while the UK will go back to being an outsider, working to balance powers on the Continent.
And NAFTA, for all the political drama to come, will remain in place. It should be an interesting year.
Grab George Friedman's Exclusive eBook, The World Explained in Maps
The World Explained in Maps reveals the panorama of geopolitical landscapes influencing today's governments and global financial systems. Don't miss this chance to prepare for the year ahead with the straight facts about every major country’s and region's current geopolitical climate. You won't find political rhetoric or media hype here.
The World Explained in Maps is an essential guide for every investor as 2017 takes shape. Get your copy now—free!
John Mauldin Archive |
© 2005-2022 http://www.MarketOracle.co.uk - The Market Oracle is a FREE Daily Financial Markets Analysis & Forecasting online publication.


