SPX is Higher But No Breakout
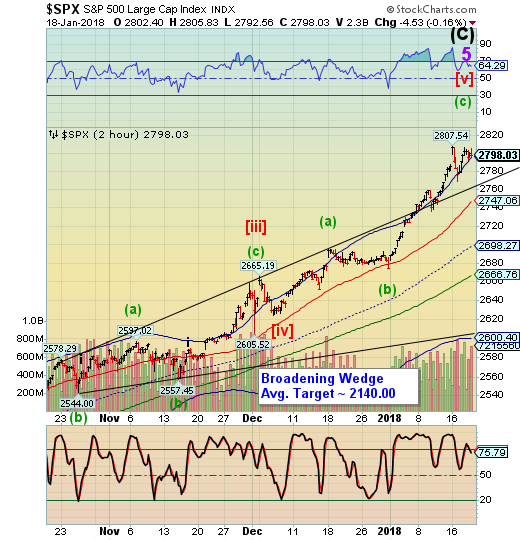
Stock-Markets / Stock Markets 2018 Jan 19, 2018 - 02:54 PM GMT SPX futures got as high as 2806.00, but could not break higher. It was higher than yesterday’s Wave three peak, producing a fifth of a fifth wave, but may not conquer Tuesday’s peak at 2807.54. Should this happen, the SPX may have made a truncated Wave v of (c). At this point, anything goes…
ZeroHedge reports, “If US and global stocks sold off yesterday on fears of a government shutdown, coupled with a spike in US Treasury yields to the highest level since March and approaching Gundlach's "equity selloff redline"...
... then it is unclear what has precipitated their rebound this morning when the threat of a US government shutdown is even more pressing - with not enough votes in the Senate as of this moment (despite it having passed the House late on Thursday) to keep government running reflected in the latest plunge in the dollar which dropped to a fresh 3 year low - while the 10Y jumped even more overnight, breaking above the crucial 2.63% level and rising as high as 2.6407, the highest since September 2016.”
…which brings us to the TNX futures. StockCharts does not register the 26.42 print in the futures which happened at 2:15 am. Since then it has backed down to yesterday’s range. For the moment I will treat the Head & Shoulders as still being valid, since the high registered on the chart is 26.26. However, I will monitor this for yet another possible “breakout.”
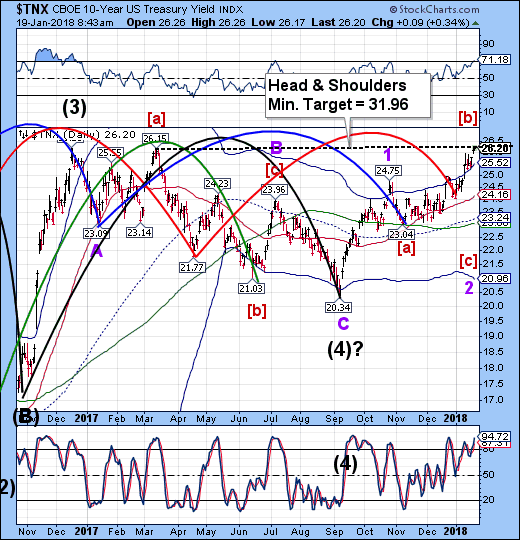
Bill Blain explains his view on ZeroHedge, “Truth lies in bonds. Over the past few months we’ve been calling the end of the long-term bull rally that began in the 1980s. As the 10-yr bond gets ready to climb from 2.6%, we are definitely into a new phase as global NIRP and ZIRP negative and zero interest rates polices reverse. US bond yields have doubled since the lows – driven by tighter monetary policy expectations, the Trump laissez-faire approach to the rising fiscal deficit (ie.. if you can’t explain it on the back of a cornflakes box, you are wasting my time), rising growth, tight labour, solid stock market and the fact the rest of the world is on the same page.”
VIX futures are rising, but no breakout yet. This verifies the rising concern, especially among institutions that can trade in the premarket.
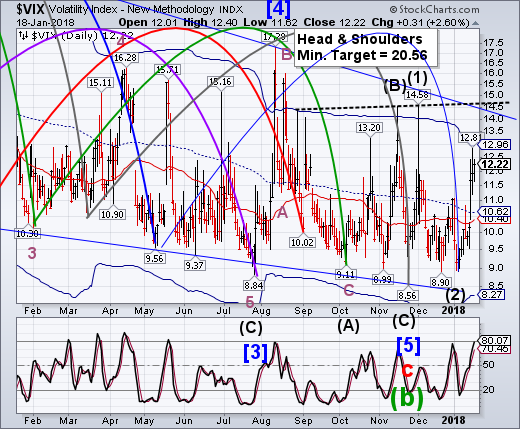
There is a quiet surrounding the VIX that is spooky. Now that several estimates have been made about when and where it may blow up, it appears that everyone is quietly watching. From our perspective the real danger zone begins at the Cycle Top which is now at 12.96. This is at the second standard deviation from the mid-Cycle at 10.63. Anything above that spells danger.
The third standard deviation is at 14.13, which is very near the neckline and Ending Diagonal trendline. The fourth standard deviation is at 15.30. Think of thes standard deviations as a “Richter Scale.” Each one represents a magnitude of several multiples of risk. I don’t know how to translate that into the magnitude of decline in the ?SPX, but my best guess is an 8-12% decline should the VIX rise to the trendline but not above it. Above that is unexplored territory, in my humble opinion.
As mentioned earlier this week, there has been a battle between the bulls and the bears. ZeroHedge observes, “Both the S&P 500 and its volatility index have been rallying; which one has it right?”
USD futures have maintained their positon at the lows. USD is still due for another small bounce into the weekend, but appears fragile.
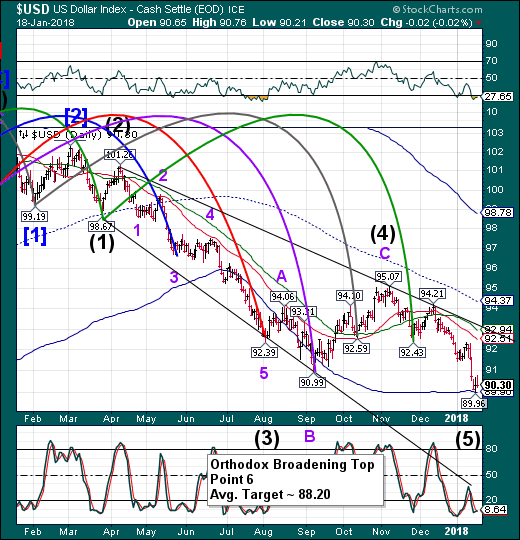
ZeroHedge features Russell Clark of the Hussman funds. Here is a summary of what he is thinking, “The worst-case scenario would be profound dollar weakness forcing the Federal Reserve to increase interest rates much more quickly than expected. Dollar weakness would cause Japanese and European exporters to suffer, forcing money into JGBs and bunds. This would be like the capital flight market in the US we saw in the late ‘70s. For reference, Swiss bonds yielded only 2% in the late 1970s, even as US rates went to near 20%.”
Crude Oil futures have broken the upper Ending Diagonal trendline. The rally is done. There may be an aggressive short play in crude here, but the confirmation of the sell signal lies beneath the lower Diagonal trendline at 61.00.
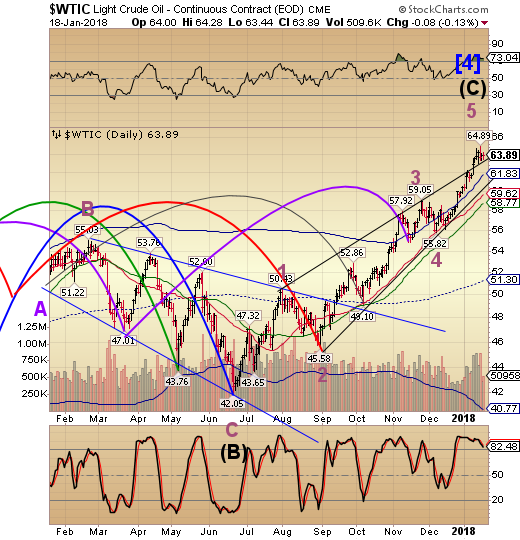
ZeroHedge writes, “Update: The IEA report has impact prices - as would be expected - sending WTI back below the crucial support level of $63 once again...”
This could be interesting.
Regards,
Tony
Our Investment Advisor Registration is on the Web.
We are in the process of updating our website at www.thepracticalinvestor.com to have more information on our services. Log on and click on Advisor Registration to get more details.
If you are a client or wish to become one, please make an appointment to discuss our investment strategies by calling Connie or Tony at (517) 699-1554, ext 10 or 11. Or e-mail us at tpi@thepracticalinve4stor.com .
Anthony M. Cherniawski, President and CIO http://www.thepracticalinvestor.com
As a State Registered Investment Advisor, The Practical Investor (TPI) manages private client investment portfolios using a proprietary investment strategy created by Chief Investment Officer Tony Cherniawski. Throughout 2000-01, when many investors felt the pain of double digit market losses, TPI successfully navigated the choppy investment waters, creating a profit for our private investment clients. With a focus on preserving assets and capitalizing on opportunities, TPI clients benefited greatly from the TPI strategies, allowing them to stay on track with their life goals.
Disclaimer: The content in this article is written for educational and informational purposes only. There is no offer or recommendation to buy or sell any security and no information contained here should be interpreted or construed as investment advice. Do you own due diligence as the information in this article is the opinion of Anthony M. Cherniawski and subject to change without notice.
Anthony M. Cherniawski Archive |
© 2005-2022 http://www.MarketOracle.co.uk - The Market Oracle is a FREE Daily Financial Markets Analysis & Forecasting online publication.


