


What Happens Next When Stock Market Investor Sentiment is Neutral
Stock-Markets / Stock Markets 2018 Mar 12, 2018 - 10:44 AM GMTBy: Troy_Bombardia

AAII is the stock market’s best sentiment gauge. Investors are extremely Neutral right now because the stock market has been swinging back and forth over the past few weeks.
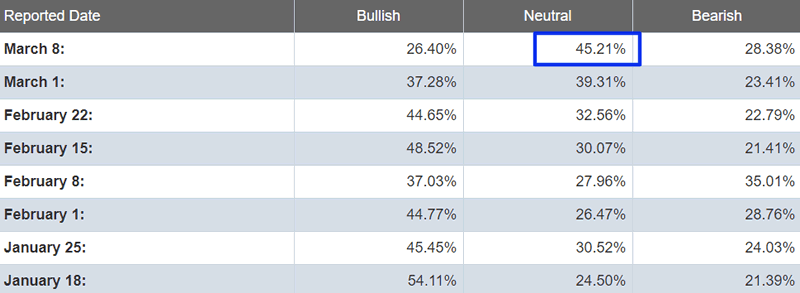
This is the first time the Neutral % has exceeded 45% since May 2016. Here are the historical cases in which AAII Neutral exceeded 45% for the first time in 1 year (52 weeks).
- July 19, 1991
- June 9, 1994
- October 23, 1997
- August 5, 1999
- February 6, 2003
- April 9, 2015
Here’s what happened next to the S&P 500.
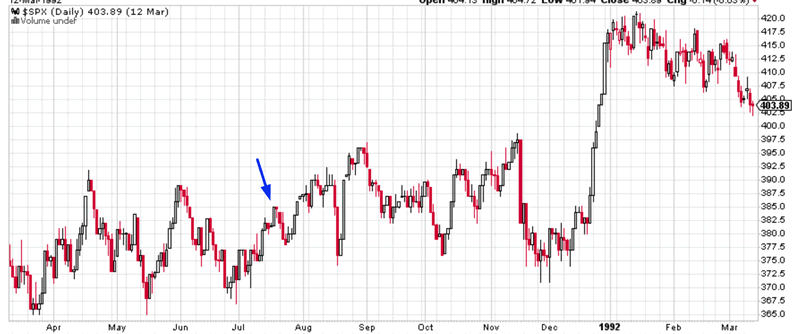
July 19, 1991
The S&P’s next 6.7% “small correction” began 4 months later in November. The S&P’s next “significant correction” began years later in 1994. The S&P trended higher over the next year.
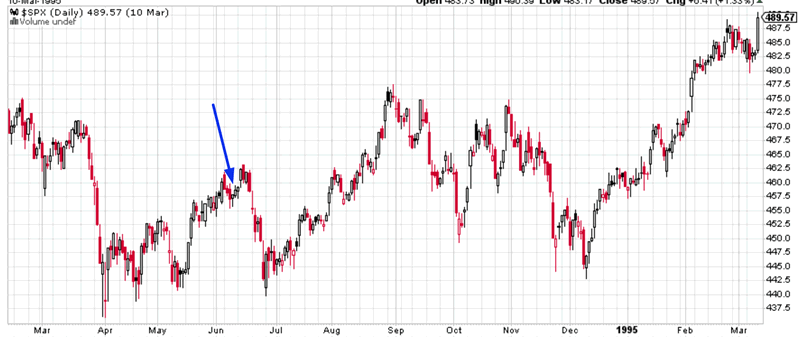
June 9, 1994
AAII Neutral exceeded 45% AFTER the S&P completed a “significant correction”. The S&P trended higher over the next year.
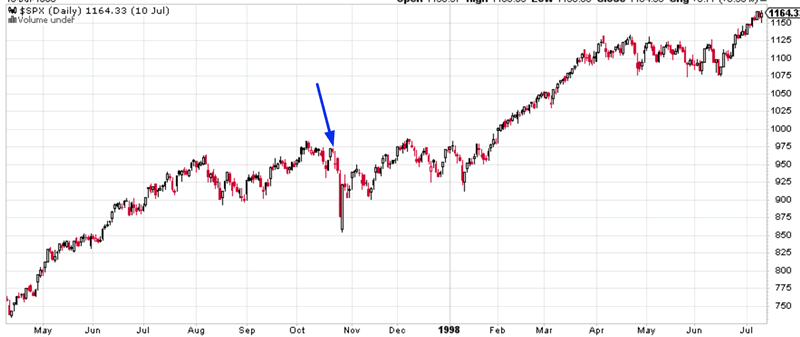
October 23, 1997
This signal came out while the S&P was in the middle of a 13% “small correction”. The next “significant correction” began 10 months later.
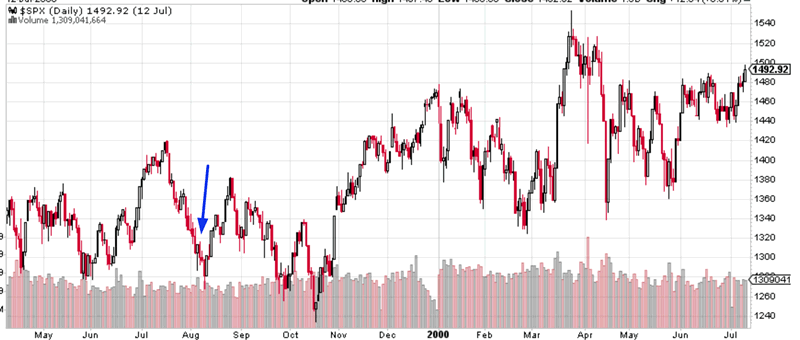
August 5, 1999
This signal occurred in the middle of a 13.1% “small correction”. The bear market began 7 months later in March 2000.
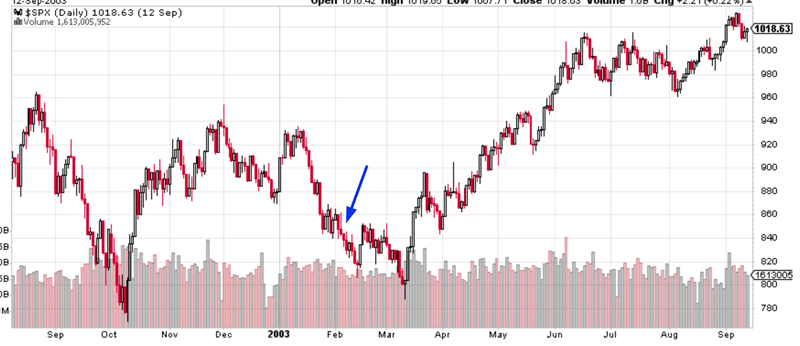
February 6, 2003
This was 1 month before the bottom of the bear market. The S&P soared over the next year.
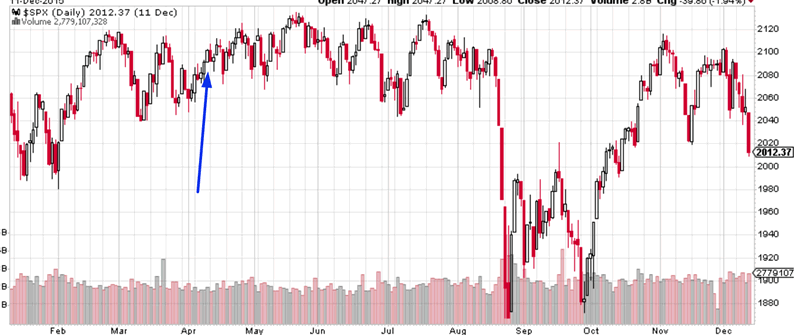
April 9, 2015
This was 1 month before the S&P’s 15.1% “significant correction” began. The Medium-Long Term Model predicted a significant correction around this time.
Conclusion
AAII Neutral exceeding 45% is a random sign for the stock market’s short term performance. It is neither a short term bullish sign nor a short term bearish sign for the stock market. Sometimes this signal comes out when the market is rallying and sometimes this signal comes out when the market is in the middle of a “small correction”.
However, this is a medium-long term bullish sign for stocks. The S&P 500 trended higher over the next 6-12 months in 5 of these 6 historical cases.
By Troy Bombardia
I’m Troy Bombardia, the author behind BullMarkets.co. I used to run a hedge fund, but closed it due to a major health scare. I am now enjoying life and simply investing/trading my own account. I focus on long term performance and ignore short term performance.
Copyright 2018 © Troy Bombardia - All Rights Reserved
Disclaimer: The above is a matter of opinion provided for general information purposes only and is not intended as investment advice. Information and analysis above are derived from sources and utilising methods believed to be reliable, but we cannot accept responsibility for any losses you may incur as a result of this analysis. Individuals should consult with their personal financial advisors.
© 2005-2022 http://www.MarketOracle.co.uk - The Market Oracle is a FREE Daily Financial Markets Analysis & Forecasting online publication.