


China Toward Sustainable Economic Growth
Economics / China Economy Mar 14, 2018 - 03:51 PM GMTBy: Dan_Steinbock

 In the past, Chinese growth was too much fueled by credit. Now it is becoming more sustainable and the emphasis is shifting on living standards, poverty reduction and environmental protection.
In his annual work report, Chinese Premier Li Keqiang said on Monday that China aims to expand its economy by around 6.5 percent this year, or the same as in 2017.
However, numbers do not tell the full story. In the past, credit growth was almost twice as high as the growth rate. Now the government’s attention is on credit risks and higher-quality growth. The latter is exemplified by rising per capita incomes, eradication of poverty and the struggle against climate change.
Decelerating growth, rising incomes
Barely a decade ago, China still enjoyed double-digit growth. Today China’s growth is slowing relative to its past performance. Historically, that is the norm with all industrializing economies.
At the same time, rapidly-rising living standards are supporting thriving consumption. This narrative can be illustrated with the first term of President Xi Jinping and Premier Li Keqiang and their projected next half a decade, assuming the current trend line and peaceful conditions will prevail (Figure 1).
Between 2012 and 2022, Chinese growth rate could decelerate from 7.9 percent to 5.8 percent. Despite deceleration, living standards will double. In 2012, Chinese GDP per capita income was about $11,000. By 2022, it may increase to $20,000. That means that per capita incomes are likely to grow by 6.7 percent in China. That’s more than four times the comparable U.S. figure in the same time period.
In other words, the past “high-speed” growth, which was typical to intensive industrialization, is morphing into “high-quality” growth. Due to China’s huge size, the repercussions will reverberate around the world.
End of abject poverty
President Xi Jinping’s idea of “Chinese dream” is predicated on greater economic focus on quality and equality of development. In the coming years, that is likely to mean investments in social equity to reduce uneven coverage of pension and health care insurance nationwide and better public services
It is also likely to translate to rejuvenation of rural areas, scaling of farming operations, increased spending on high school education and vocational training, affordable housing and extended rural land leases - and an aggressive push to eradicate poverty.
In his report, Li Keqiang said the government would seek to lift a further 10 million out of poverty in 2018, adding to the 68 million already relieved of that burden over the past five years (Figure 2).
China’s progressive eradication of poverty is a world-historical milestone.
Against climate change
A key aspect of new growth is Beijing’s goal to restore blue skies over the mainland by cutting pollutants dramatically by 2020, coupled with efforts to attract investors to put substantial funds into environmental rehabilitation.
Overall, the new stress on environmental protection means new technologies in green manufacturing and clean energy; cleaning up air, water and soil pollution; green finance; emissions-reduction per targets; and tighter environmental rules.
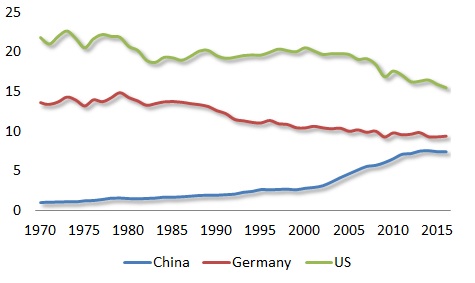
In aggregate terms, China has been the greatest polluter worldwide since the early 2010s. Yet, emissions must be measured on per capita terms, which allow true international comparisons because population size contributes significantly to countries’ aggregate pollution levels. In this comparative view, per capita emissions in China have never exceeded those in Germany and the US (Figure 3).
In the past half century, U.S. carbon dioxide (CO2) emissions have slowly decreased from more than 22 ton per capita to less than 16; in Germany, from 15 to less than 10. In China, per capita emissions increased dramatically during the reform period, due to rapid industrialization and export-led manufacturing. However, per capita emissions peaked at 7.5 in the mid-2010s but are now decreasing.
Double standards and climate change
In other words, even at the peak of industrialization, Chinese per capita emissions were only one third of the peak level in the US and only half of the corresponding German level.
It should also be recalled that, historically, the heavy phase of US and German industrialization took place a century ago. So when these two countries were in the stage of development in which China is today, their per capita emissions were far higher relative to China.
In China, it is imperative to cut down emissions as fast as possible, to ensure higher-quality growth. But it would be far, far more beneficial internationally if the major advanced economies would reduce their wasteful living styles, which in the 21st century will penalize future generations in emerging economies.
Double standards benefit nobody and only delay the inevitable.
Figure 1 China’s Growth Rate and Per Capita Income
2012-E2022
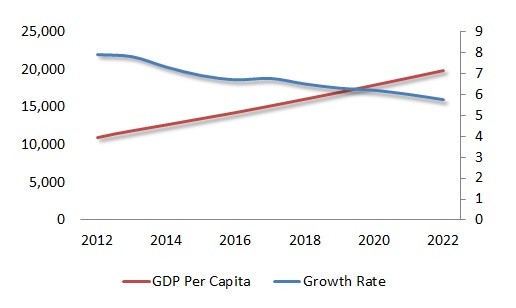
Figure 2 Lifting People from Poverty
2000-2018 (in millions)
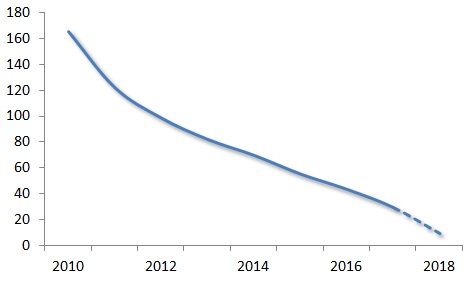
Figure 3 Emissions: China, Germany and the US, 1970-2016
Co2 tons per capita, 1970-2016
Sources: 1. WEO/IMF. 2. China Statistical Yearbook. 3. EDGAR.
Dr Steinbock is the founder of the Difference Group and has served as the research director at the India, China, and America Institute (USA) and a visiting fellow at the Shanghai Institutes for International Studies (China) and the EU Center (Singapore). For more information, see http://www.differencegroup.net/
© 2018 Copyright Dan Steinbock - All Rights Reserved
Disclaimer: The above is a matter of opinion provided for general information purposes only and is not intended as investment advice. Information and analysis above are derived from sources and utilising methods believed to be reliable, but we cannot accept responsibility for any losses you may incur as a result of this analysis. Individuals should consult with their personal financial advisors.
© 2005-2022 http://www.MarketOracle.co.uk - The Market Oracle is a FREE Daily Financial Markets Analysis & Forecasting online publication.