


Markets Could Rise on Commodity Prices in April
Stock-Markets / Financial Markets 2018 Apr 03, 2018 - 08:31 AM GMTBy: Builderadv

 Despite all the volatility during the first quarter, the first three months of 2018 stock markets correcting but recovering towards the fag-end. The Dow Industrials were the biggest losers with a quarterly drop of -2.5%. The broader S&P 500 Index lost only -1.2%. While the tech dominated Nasdaq Composite gained 2.3%. Small caps saw only a marginal loss (-.40%). The Vanguard Total Stock Market ETF (VTI) captures the entire stock market by size (large, small, and midsize) and by style (growth and value). And it lost only -.71% from the end of December to the end of March.
Total StockMarkets: At support levels
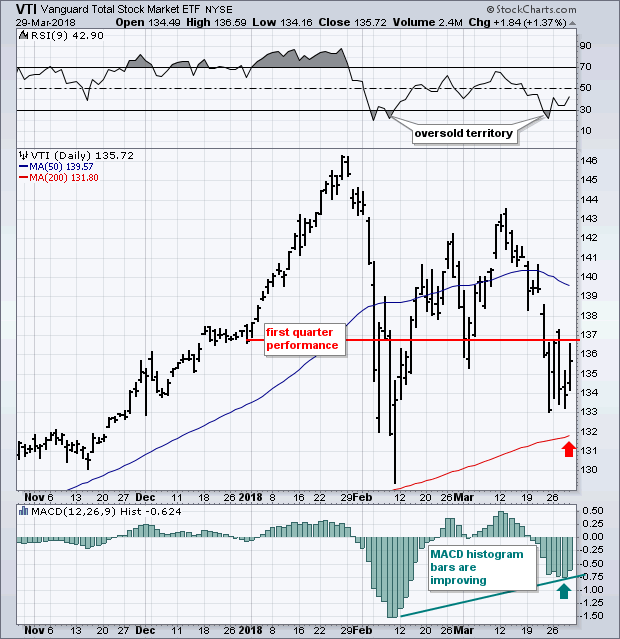
Corrections usually take place in three waves (first downleg, a recovery, and then a retest of the prior low). So far, that retest has been successful. The VTI has remained above its 200-day moving average (red arrow) and its February low. Short-term indicators are starting to look better. The 9-day RSI line (top box) is rebounding from oversold territory below 30 for the second time. MACD histogram bars (lower box) are still below their zero line, but remain well above their February low and are starting to climb (see rising trendline). Both of which suggest that the worst of the current correction may be behind us.
Volatility is waning
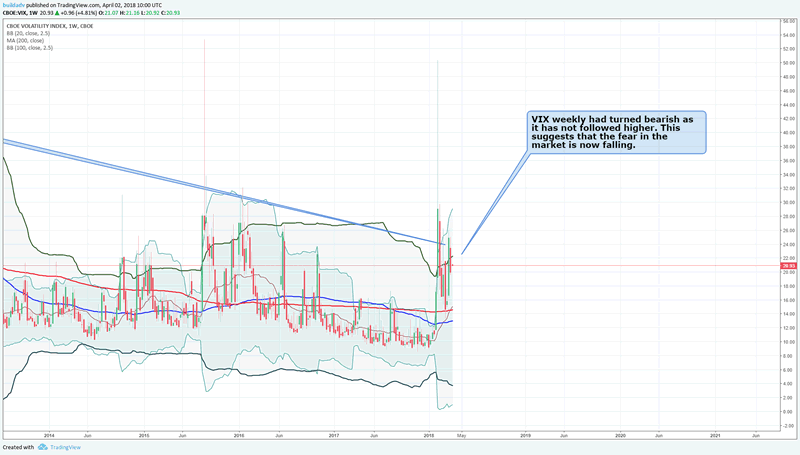
VIX weekly had turned bearish as it has not followed higher. This suggests that the fear in the market is now falling.
DJCI commodity index has been rising and not fallen with other markets. When the risk appetite returns, this will move to new highs and will add bullish pressure to AUD,CAD and NZD as currencies while all commodity stocks will move higher
DJCI bullish trends on weekly as the index is well above the 20 WMA.
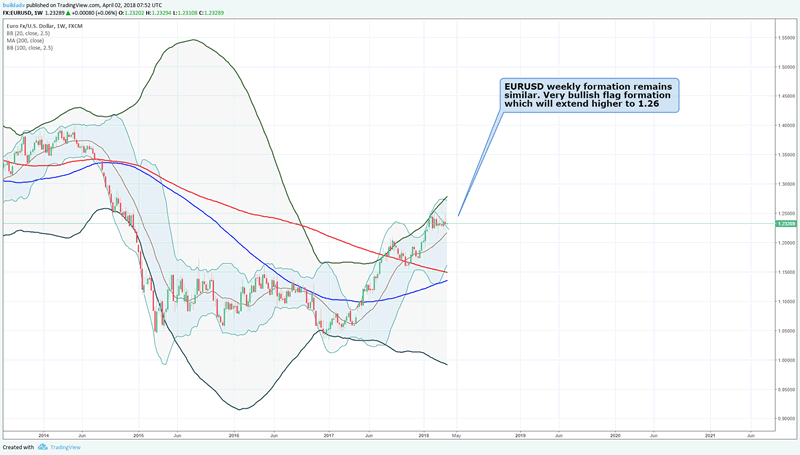
EURUSD weekly formation remains similar. Very bullish flag formation which will extend higher to 1.26
AUDUSD Weekly
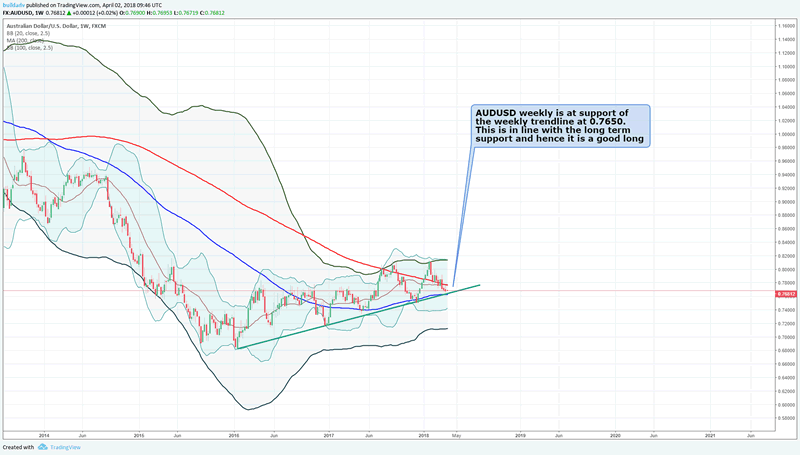
AUDUSD weekly is at support of the weekly trendline at 0.7650. This is in line with the long term support and hence it is a good long
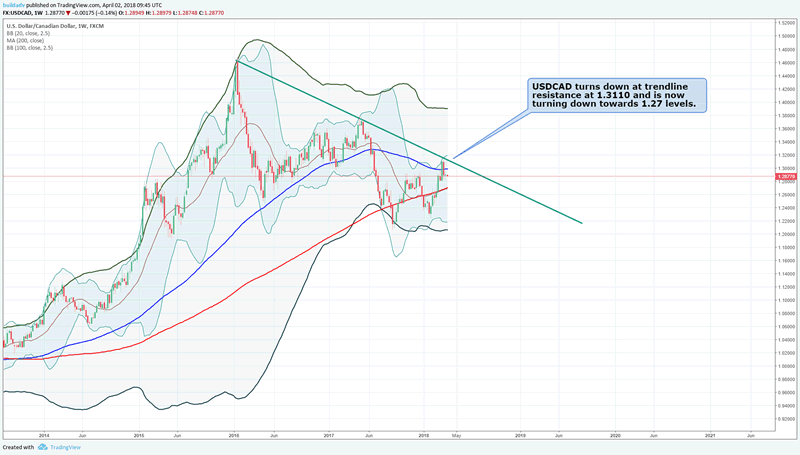
USDCAD Weekly
USDCAD turns down at trendline resistance at 1.3110 and is now turning down towards 1.27 levels.
S&P Bank ETF
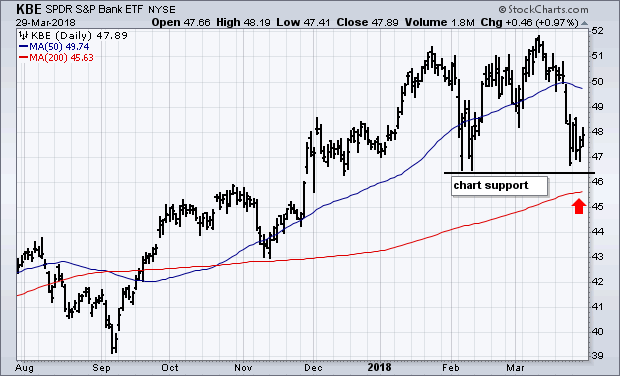
Financial stocks, and banks in particular, have also lost ground during March. But it is critical support. The support is valid for over a week now and hence we conclude that bears have lost interest in clearing the support. Financials are the second biggest sector in the S&P 500 (behind technology). That's why it's encouraging to see banks and social media stocks starting to bounce together from underlying support levels. Until proven otherwise, technical odds favor those support levels holding.
COPPER MINERS ETF BOUNCES OFF 200-DAY LINE
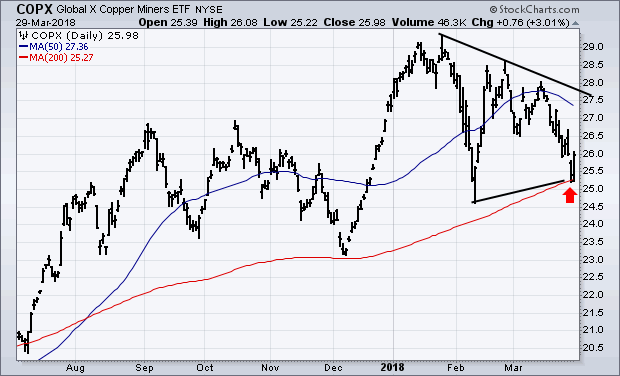
Shares tied to industrial metals have fallen along with those economically-sensitive commodities during the first quarter. But, there again, things may be taking a turn for the better. The Global X Copper Miners ETF (COPX) bouncing off its 200-day moving average yesterday (red arrow). Its ability to stay above its February low also suggests formation of a bullish "symmetrical triangle". That pattern is defined by two converging trendlines and usually signals continuation of its main uptrend. Freeport McMoran (FCX) gained nearly 5% on Thursday and was the biggest percentage gainer in the Materials Sector SPDR (XLB). That may also be a sign that industrial metals like copper may start to strengthen again as faith in the global economic recovery is restored. This is further confirmed with DJCI index being at strong bullish levels.
Advance Decline Line
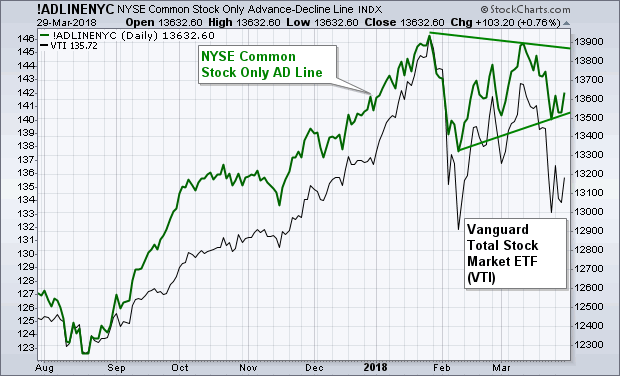
Market breadth is holding up very well. At most market tops, the NYSE Advance-Decline line usually turns down first and leads the rest of the market lower. The NYSE Common Stock Only Advance-Decline line going through a relatively mild pullback during the first quarter (with its converging trendlines forming a triangular consolidation pattern). It increases the technical odds for continuation of the market's nine year bull run. And for a better second quarter.
TradeCopier: Rises in March
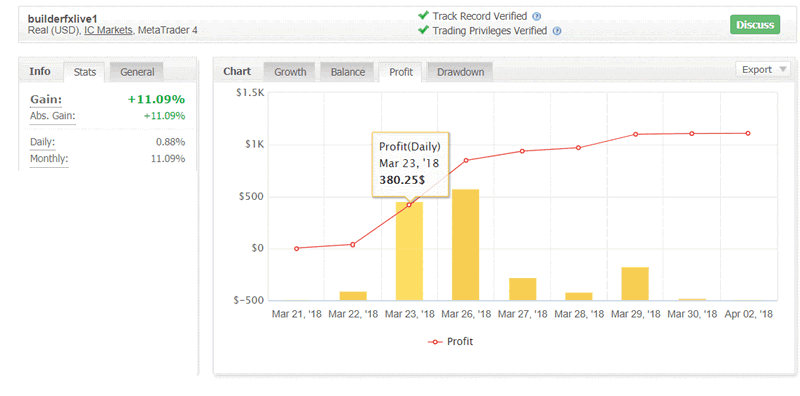
The live account rises in March. Profitable trading. No other asset class can make as much money as forex trading does. However the risk also are higher and DD is higher as well.
Historically speaking, the trading system has returned positive returns every single month since January 2010. See the above performance of the trading system. It is making over 10% everymonth.
If you would like to start a trade copier connection with your account to copy our trades, please reach out to us : Contact us
Summary: Markets are at support levels across sectors. The NYSE a/d line has recovered and we see a clear bounce in US equity markets and this will lead all equity markets worldwide. Commodities to pick up in April and this will help commodity currencies as well. Volatility is dipping as we start a new quarter, all of which is suggesting a good quarter for stocks.
By Buildadv
About Buildadv:
Buildadv is a investment management firm. We specialize in premium trading research, chart setups, trading insights and a forex trade copier which generates returns for MT4 trading clients. We operate the BUILDFX Trading system which has a rich history of over 8 years of trading history generating an average return of over 15% a month.
Email: adminsupport@buildadv.com
Website: http://buildadv.com/contact/
Copyright 2018 © Buildadv - All Rights Reserved
Disclaimer: The above is a matter of opinion provided for general information purposes only and is not intended as investment advice. Information and analysis above are derived from sources and utilising methods believed to be reliable, but we cannot accept responsibility for any losses you may incur as a result of this analysis. Individuals should consult with their personal financial advisors.
© 2005-2022 http://www.MarketOracle.co.uk - The Market Oracle is a FREE Daily Financial Markets Analysis & Forecasting online publication.