


Adaptive Dynamic Learning Predicts Massive Stock Market Bottom
Stock-Markets / Stock Markets 2018 Apr 05, 2018 - 12:43 PM GMTBy: Chris_Vermeulen

 Our research team at Technical Traders Ltd. has been hard at work trying to identify if this recent downside price move is more concerning or just a rotational move. The recent global news regarding the US/China trade tariffs as well as the fallout that started nearly two weeks ago in Technology with Facebook, Snap and others has spooked the markets. Our additional research shows that China and Asia are extremely fragile at the moment and the global Central Bankers as well as the Real Estate market could be key to any future unraveling of the markets.
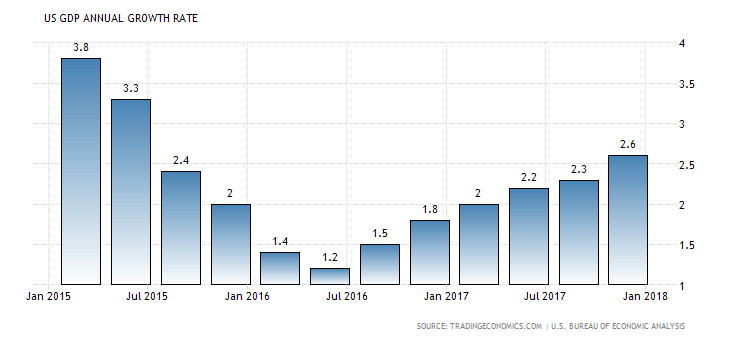
Yet, at this time we believe our predictive modeling systems and analytical systems are indicating a strong market recovery is just days away. As we have discussed earlier, capital is constantly searching for the safest and most reliable ROI throughout the planet at all times. We believe the current market environment will show signs that stronger, more established economies will continue to benefit from capital migration as a result of this new wave of uncertainty plays out. The US DGP growth rate over the past 2 years has been exceptional – increasing over 200% from 2015~2016 averages of 1.48%

As you might have read from our China/Asia Implosion research, there are many factors at work currently in the markets and the one thing that is a constant is consumer and debt cycles. Additionally, we have been relying on our cycle analysis, Adaptive Fibonacci modeling system and our incredible Adaptive Dynamic Learning modeling system (ADL), for much of our analysis throughout the end of 2017 and early 2018. Today, we are going to share what we believe to be one of the most amazing analytical calls of this year – a potentially massive rally in the US markets.
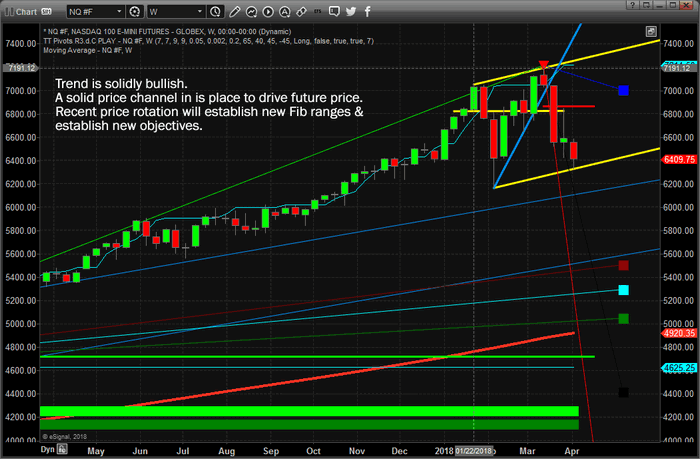
First, our Weekly Fibonacci modeling system is still showing strong bullish signs while indicating recent price rotation is below bearish trigger levels. Because of this last component, we are still concerned that unknown factors could derail any price recovery that our advanced modeling systems are predicting. Yet, we believe the core elements of Capital Migration and the fact that capital will chase the greatest ROI and safest environment for future liquidity and growth indicate that the US markets are the only game in town. The newly established price channel can be clearly seen in the chart below.
As we consider the fragility of the global markets as well as the potential that foreign and domestic capital will likely be migrating into the US Equity markets in an attempt to maintain ROI and liquidity that is simply unattainable in other global markets. Risks are starting to stack up in many foreign markets with Brexit, debt issues, cycle rotations and other issues. Yet, the US markets have recently been unleashed in terms of growth expectations and regulations.
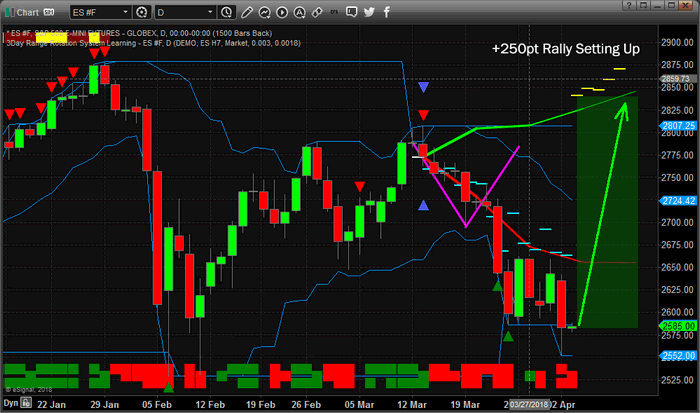
This S&P Daily chart showing our ADL predictive price modeling system is clearly showing the price anomaly that is currently setting up. Prices are been pushed much lower – below our price expectations shown as DASHES on the chart. Yet we need to pay attention to the dramatic price reversal setting up to the upside. Without our ADL price modeling system and the ability to identify these types of setups, we would have little knowledge that this type of dramatic price increase is about to hit the US markets.
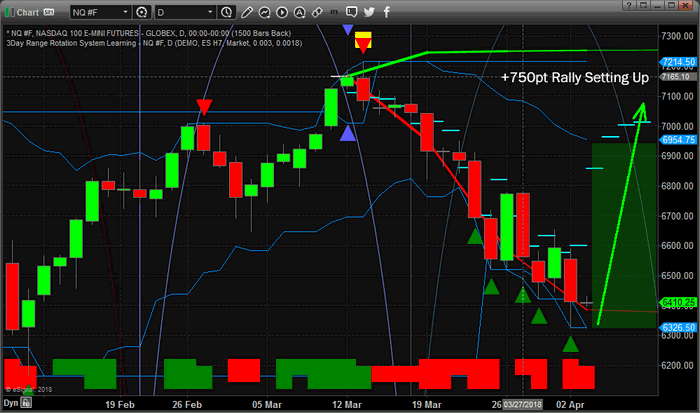
Additionally, when we compare the ES chart (above) to this NQ chart (below), we can see another price anomaly that is setting up in the US markets. These types of price anomalies are quite unique in the sense that they represent a price disconnect that usually results in a violent and dramatic price reconnect. In other words, when these types of price anomalies happen, price is driven outside normal boundaries of operation for periods of time, then it recovers to near the projected price levels – just like it did in early February 2018 with a dramatic downside price correction.
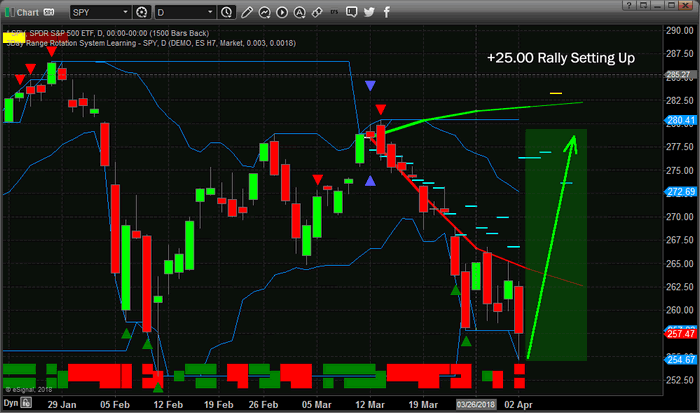
Lastly, this SPY chart below is confirming all of our price analysis with a very clear picture of the price anomaly that is currently setting up. External news factors have driven the current price to well below the expected ADL levels and setup what may turn out to become a Double Bottom in the process. Yet, the most critical part of all of this is the potential of a massive 10% or greater price rally over the next 3 to 10 days.
Many people simply don’t believe our ADL system can be this accurate, yet we urge readers to visit www.TheTechnicalTraders.com to review our research articles from late 2017 and early 2018 to see for yourself how well it has worked out so far. You don’t want to miss this move and what follows. This move will be a huge opportunity as our analysis is showing the potential for 8 to 12+% price advances over the next 30 to 60 days.
We are writing this message to alert all of our members and followers that we are uniquely positioned to take advantage of this move while others are preparing for the potential price decline that is evident by move traditional technical analysis modeling system. If you want to learn how to stay ahead of these moves and profit from this type of adaptive predictive price modeling, then please visit our website to learn more about our stock and ETF service for active traders and investors.
Our articles, Technical Trading Mastery book, and 3 Hour Trading Video Course are designed for both traders and investors to explore the tools and techniques that discretionary and algorithmic traders need to profit in today’s competitive markets. Created with the serious trader and investor in mind – whether beginner or professional – our approach will put you on the path to win. Understanding market structure, trend identification, cycle analysis, volatility, volume, when and when to trade, position management, and how to put it all together so that you have a winning edge.
GET OUR ETF ALERTS TODAY!
With 53 years experience in researching and trading makes analyzing the complex and ever-changing financial markets a natural process. We have a simple and highly effective way to provide our customers with the most convenient, accurate, and timely market forecasts available today. Our stock and ETF trading alerts are readily available through our exclusive membership service via email and SMS text. Our newsletter, Technical Trading Mastery book, and 3 Hour Trading Video Course are designed for both traders and investors. Also, some of our strategies have been fully automated for the ultimate trading experience.
Chris Vermeulen
Technical Traders Ltd.
Chris Vermeulen
www.TheTechnicalTraders.com
Chris Vermeulen has been involved in the markets since 1997 and is the founder of Technical Traders Ltd. He is an internationally recognized technical analyst, trader, and is the author of the book: 7 Steps to Win With Logic
Through years of research, trading and helping individual traders around the world. He learned that many traders have great trading ideas, but they lack one thing, they struggle to execute trades in a systematic way for consistent results. Chris helps educate traders with a three-hour video course that can change your trading results for the better.
His mission is to help his clients boost their trading performance while reducing market exposure and portfolio volatility.
He is a regular speaker on HoweStreet.com, and the FinancialSurvivorNetwork radio shows. Chris was also featured on the cover of AmalgaTrader Magazine, and contributes articles to several leading financial hubs like MarketOracle.co.uk
Disclaimer: Nothing in this report should be construed as a solicitation to buy or sell any securities mentioned. Technical Traders Ltd., its owners and the author of this report are not registered broker-dealers or financial advisors. Before investing in any securities, you should consult with your financial advisor and a registered broker-dealer. Never make an investment based solely on what you read in an online or printed report, including this report, especially if the investment involves a small, thinly-traded company that isn’t well known. Technical Traders Ltd. and the author of this report has been paid by Cardiff Energy Corp. In addition, the author owns shares of Cardiff Energy Corp. and would also benefit from volume and price appreciation of its stock. The information provided here within should not be construed as a financial analysis but rather as an advertisement. The author’s views and opinions regarding the companies featured in reports are his own views and are based on information that he has researched independently and has received, which the author assumes to be reliable. Technical Traders Ltd. and the author of this report do not guarantee the accuracy, completeness, or usefulness of any content of this report, nor its fitness for any particular purpose. Lastly, the author does not guarantee that any of the companies mentioned in the reports will perform as expected, and any comparisons made to other companies may not be valid or come into effect.
Chris Vermeulen Archive |
© 2005-2022 http://www.MarketOracle.co.uk - The Market Oracle is a FREE Daily Financial Markets Analysis & Forecasting online publication.