


Stock Market’s High Uncertainty is Medium Term Bullish for Stocks
Stock-Markets / Stock Markets 2018 Apr 08, 2018 - 03:51 PM GMTBy: Troy_Bombardia

 The stock market’s volatility has been crazy recently. It’s clear that the majority of investors and traders are undecided. It soars a few percent over 2 days, then tanks a few percent over 2 days, then soars, then tanks…
We can see this uncertainty in the market’s breadth as well. The NYSE’s Up Volume indicates the number of stocks that went up today.
8 out of the past 11 trading days have seen Up Volume either above 80% (i.e. most stocks surging) or below 20% (i.e. most stocks going down). This is a rare medium term bullish sign for the stock market.
Here are the historical cases when the market’s breadth was this uncertain (8 of the past 11 trading days having more than 80% Up Volume or less than 20% Up Volume)
- April 6, 2018 (current case)
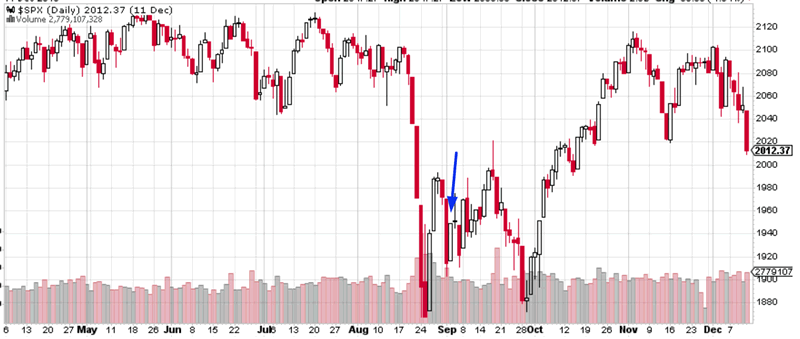
- September 2, 2015
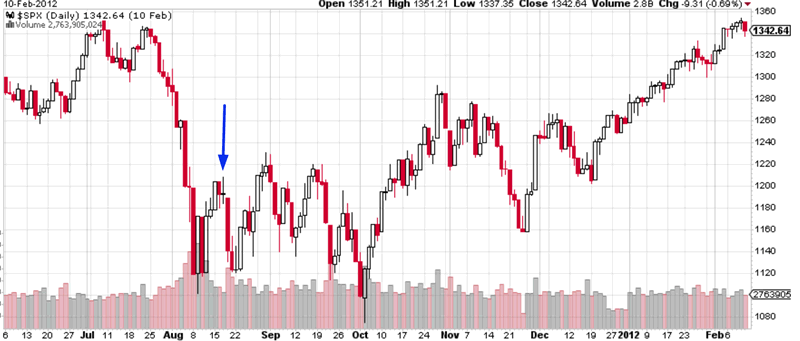
- August 16, 2011
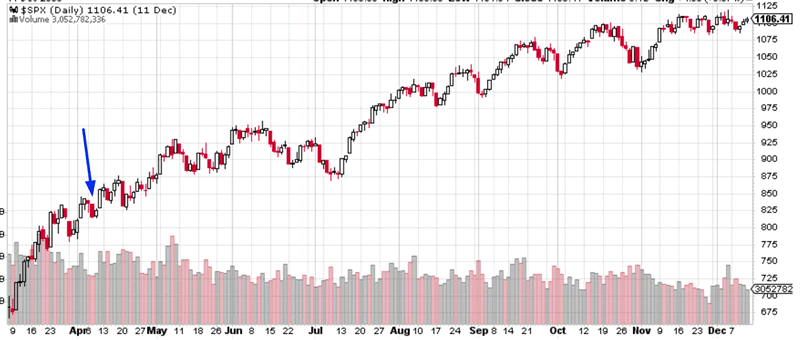
- April 3, 2009
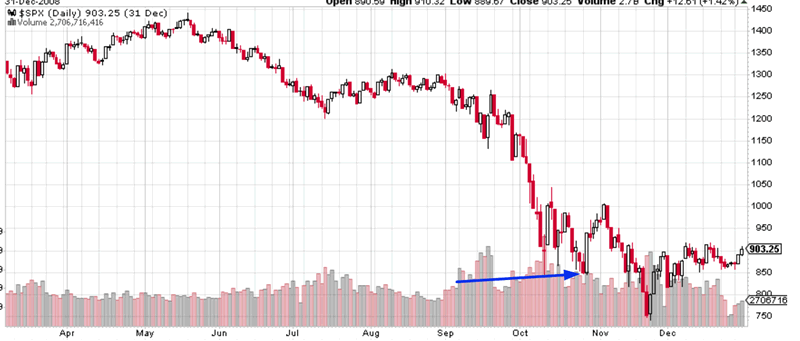
- October 27, 2008
- October 16, 2002
- August 30, 1966
- May 17, 1966
- June 22, 1962
- November 29, 1957
Here’s what happened next to the S&P 500.
September 2, 2015
This occurred near the bottom of the S&P’s 15% “significant correction”. The stock market fell a little more in the short term, but the downside was limited. The stock market went up over the next few months.
August 16, 2011
This occurred near the bottom of the S&P’s 21.5% “significant correction”. The stock market fell a little more in the short term, but the downside was limited.
April 3, 2009
This occurred after the S&P’s 2007-2009 bear market ended. The S&P continued to soar after this date.
This historical case doesn’t apply to today because the S&P has made a 9 year bull market so far. We are not at the bottom of a bear market.
October 27, 2008
The S&P made a bounce over the next 2 weeks but then proceeded to make new lows
This occurred in the middle of bear market and recession, AFTER the S&P had already fallen >40%. This historical case does not apply to today. We are not in a recession right now.
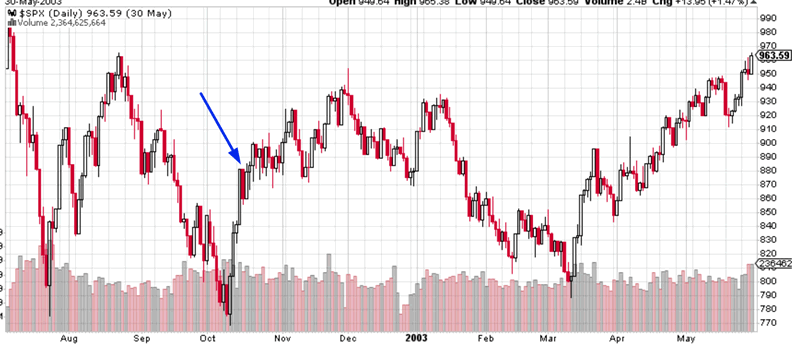
October 16, 2002
The S&P continued to rally for another 2 months and then retraced. It didn’t make a bear market low in March 2003. Then the S&P proceeded to soar throughout the rest of 2003.
August 30, 1966
This occurred in the beginning of the S&P 500’s 23.6% “significant correction”. But even though the S&P went on to make new lows, it rallied a little bit over the next 2 months. The medium term’s downside was limited.
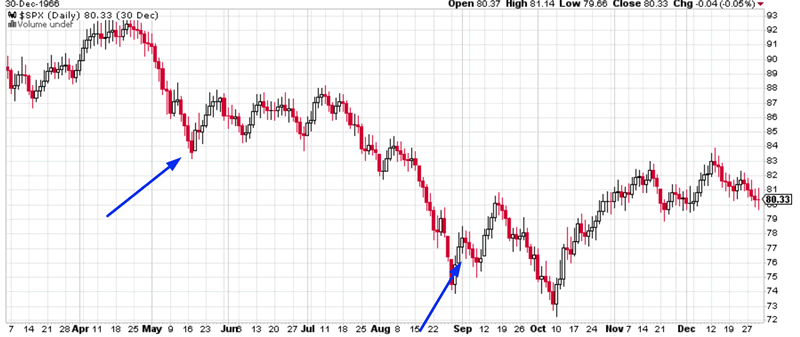
May 17, 1966
This came close to marking the 23.6% “significant correction’s” bottom. The S&P made a marginal new low 1.5 months later, but then it surged to new all time highs by 1967.
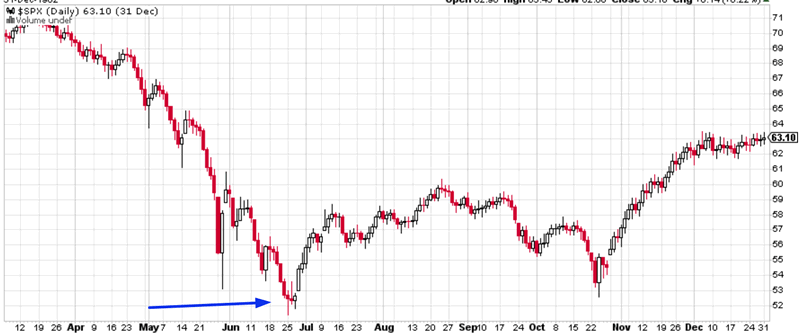
June 22, 1962
This occurred near the bottom of the S&P 500’s 29.3% “significant correction”.
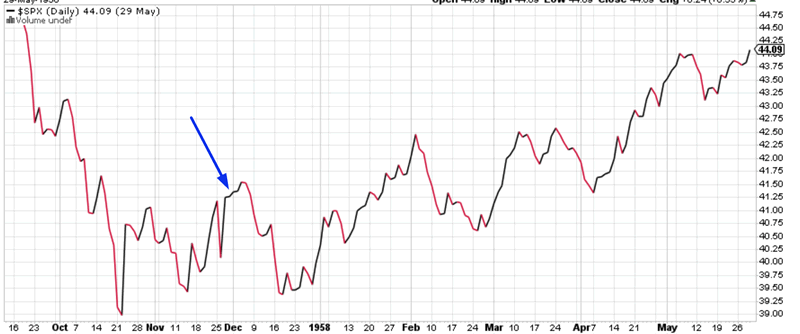
November 29, 1957
Conclusion
This is a medium term bullish sign for the stock market. If we exclude the recession and post-bear market cases, the S&P always went up over AT LEAST the next 1-2 months.
*The S&P 500 is not in the midst of a recession today, that’s why we exclude those cases. The economy is still growing.
Even the worst case scenario – August 30, 1966 – saw the S&P go up a little over the next 1.5 months.
By Troy Bombardia
I’m Troy Bombardia, the author behind BullMarkets.co. I used to run a hedge fund, but closed it due to a major health scare. I am now enjoying life and simply investing/trading my own account. I focus on long term performance and ignore short term performance.
Copyright 2018 © Troy Bombardia - All Rights Reserved
Disclaimer: The above is a matter of opinion provided for general information purposes only and is not intended as investment advice. Information and analysis above are derived from sources and utilising methods believed to be reliable, but we cannot accept responsibility for any losses you may incur as a result of this analysis. Individuals should consult with their personal financial advisors.
© 2005-2022 http://www.MarketOracle.co.uk - The Market Oracle is a FREE Daily Financial Markets Analysis & Forecasting online publication.