


Sugar Commodity Buying Levels Analysis
Commodities / Commodities Trading Apr 14, 2018 - 05:12 PM GMTBy: Austin_Galt

 Pattern – price is clearly in a downtrend…which I think is finished, for the time being anyway. Price made a little inside candle the day before last and the last day’s trading saw price breach the high of the previous day which is often a sign of a change in trend. Price will, obviously, need to trade further up to confirm this suspicion of mine.
PSAR – this has indicator has now turned bullish with the dots now underneath price. A good sign for the bulls but nothing to get too excited about.
Daily Chart
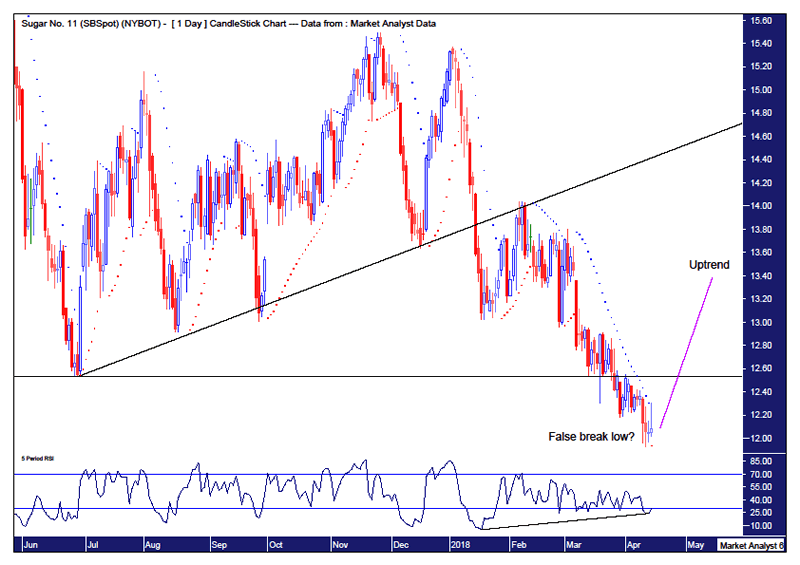
Horizontal line – denotes the low before the bear rally commenced. Price has now broken below this level and I believe this will be a false break low, at the recent low of $11.93 which is probably where stops should be placed. We will know if that is true shortly.
Trend line – as often happens, after the first break of this trend line price rallied back up to this line before being turned back down. This trend line will be in focus for technical analysts and, given time, I favour price to crack marginally above this line just to put some doubt into the minds of said analysts before price resumes the overall downtrend.
RSI – a bullish divergence is in place.
Weekly Chart
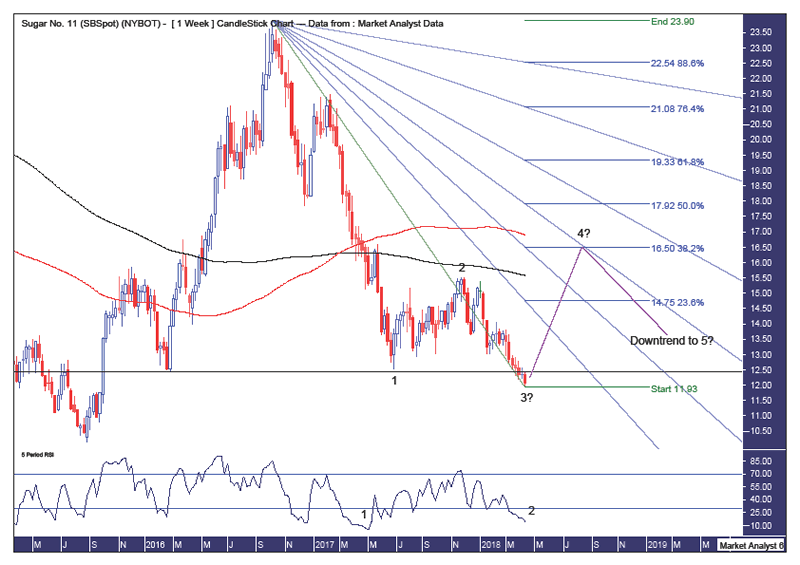
Pattern – while it is too early to say, it is my belief that a 5 point broadening low is at hand with the recent low being the point 3 low and the predicted bear rally to set up a point 5 high before the bear trend resumes and eventually ends with a point 5 low.
Fibonacci – assuming this analysis to be correct, and that is obviously still to be confirmed, then I am targeting a bear rally to terminate around the 38.2% retracement level at $16.50 which would keep the overall downtrend in a relatively strong position. To help with some timing I have added fan angles and the 50% angle looks to intersect with the 38.2% retracement level in August 2018.
Horizontal line – denotes a double bottom which given it was above the previous low is generally bullish. So, the fact that price has broken below this level is ultimately bearish and leads me to believe any rally now will be a bear rally only.
Moving averages – bearish with the 100 day moving average (red) above the 200 day moving average (black). I favour any bear rally now to return to the red line which I expect to act as resistance.
RSI – a bullish divergence is in place and before the final low is had I favour a triple bullish divergence to form.
Summing up, bullish at current levels, looking for a bear rally to add 35 – 40% in price.
By Austin Galt
Austin Galt has previously worked as a stockbroker and investment banker while studying technical analysis for over two decades. He is also the author of the book White Night: A Colombian Odyssey
Email - info@thevoodooanalyst.com
© 2018 Copyright The Voodoo Analyst - All Rights Reserved
Disclaimer: The above is a matter of opinion provided for general information purposes only and is not intended as investment advice. Information and analysis above are derived from sources and utilising methods believed to be reliable, but we cannot accept responsibility for any losses you may incur as a result of this analysis. Individuals should consult with their personal financial advisors.
Austin Galt Archive |
© 2005-2022 http://www.MarketOracle.co.uk - The Market Oracle is a FREE Daily Financial Markets Analysis & Forecasting online publication.