


Trading Markets Amid Sound of Wars
Stock-Markets / Financial Markets 2018 Apr 15, 2018 - 05:30 PM GMTBy: Builderadv

 Given the sound of wars both in actual terms and in economic terms, what do we see for the next few weeks into stock markets and forex markets ? We must delink our trading from event risk and be focussed on actual data and trading trends. Never trade what should happen but trade what is happening. The political situation is fluid with rumors of Trump unhappiness with Mueller investigations. Then there is the war machine which has kicked a gear with attack on Syria. This is not the end. We need to wait if this is going to go deeper if Russia responds. Then there is a underlying current of trade wars which is yet to be settled. A far lesser event is the earning season which is now upon but markets are still trading at 24x P/E so its fully priced in for a great earning season. In fact if market corrects another 10%, it is still fully valued.
Stock Markets: We have big down move exceeding 5% coming
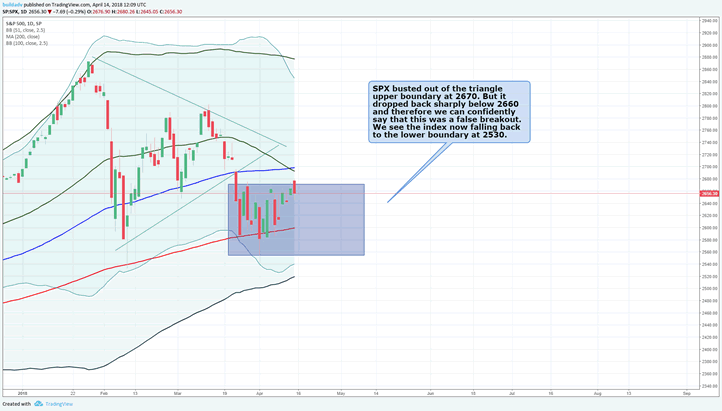
SPX busted out of the triangle upper boundary at 2670. But it dropped back sharply below 2660 and therefore we can confidently say that this was a false breakout. We see the index now falling back to the lower boundary at 2530. The movement in the forex markets will give us futher clues.
JXY Daily
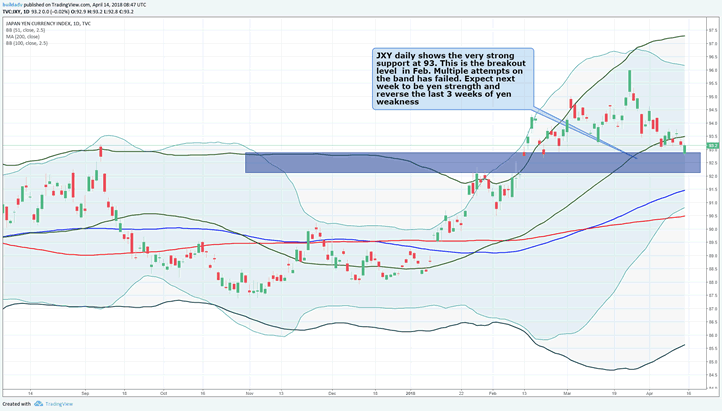
The rectangle shows the volume profile where there is very little volumes. Markets often tend to move away from these zones very quickly. We see yen index taking support here and rising. Please note that this is not the USDJPY but the YEN index. When the the index rises, USDJPY falls.
Japanese Index JXY weekly
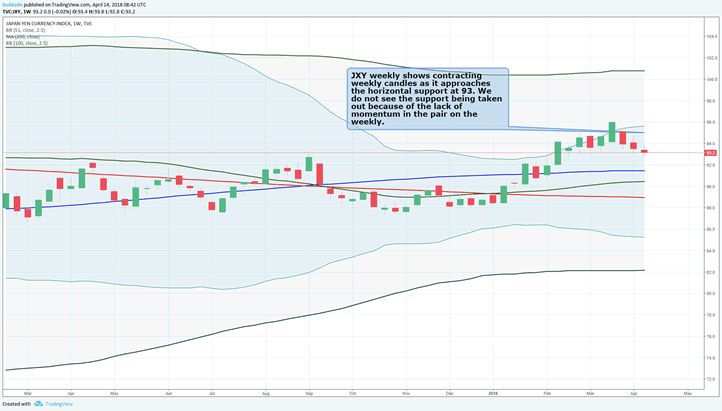
JXY weekly shows contracting weekly candles as it approaches the horizontal support at 93. We do not see the support being taken out because of the lack of momentum in the pair on the weekly.
CFTC positions
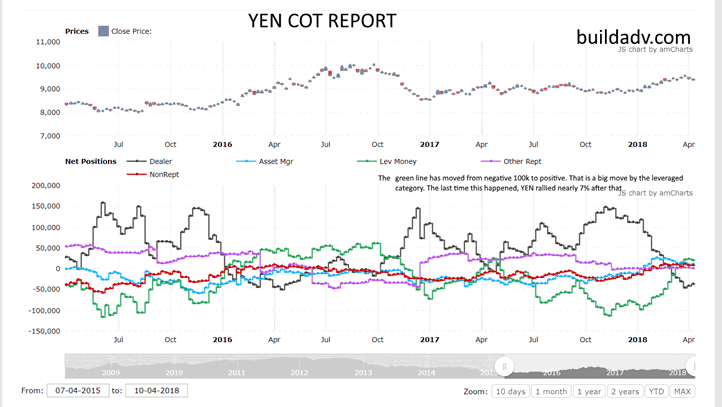
YEN cot reports show the short covering seen in leveraged category. From a negative 100k, we moved to +3k. This is a big move and the last time this happened, YEN rallied another 7 to 8% after that.
Why is the yen appreciating?
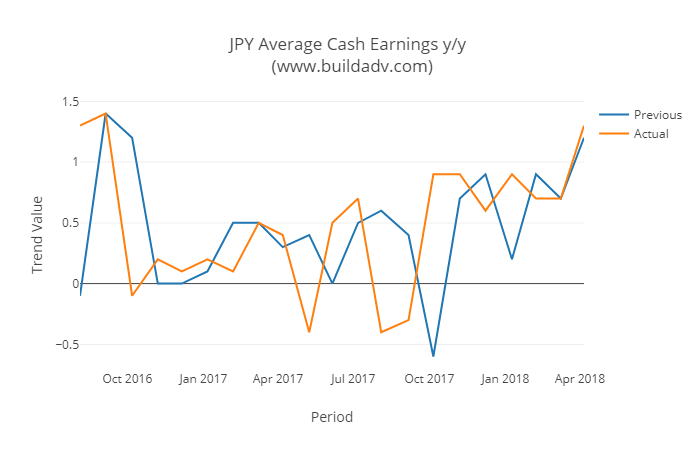
Well the simple answer is that the Japanese economy is pulling out of a recession and is recovering to its strongest in years. The BoJ will have no choice but to remove the stimulus and the fall IN USDJPY has just started. One of the key metrics for the economy is the cash earnings. Average Cash Earnings y/y is reported at 1.3% which came in higher than the previous release at 1.2%Average Cash Earnings y/y reported at 1.3%. This is higher than the expected number at 0.5%. The mean for " Average Cash Earnings y/y " over the last 21 releases has been 0.5. The current released data is greater than the mean of the last 21 releases. See the trends below between the past and actual release.
EUR forecasts
Inflation picks up in EU
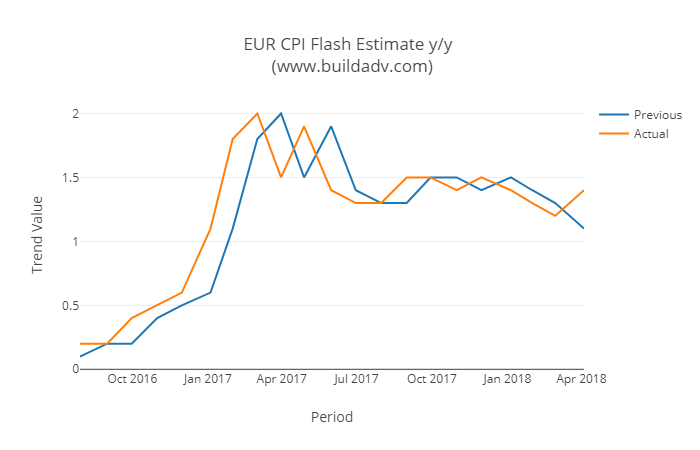
Eurozone consumer prices picked up in March for the first time in four months, while the unemployment rate fell to its lowest level in more than nine years during February, developments that will reinforce the European Central Bank’s belief that it is on track to meet its inflation target over coming years. The European Union’s statistics agency Wednesday said consumer prices in that month were 1.4% higher than a year earlier, an increase from the 1.1% rate of inflation recorded in February.
Industrial production in France picks up
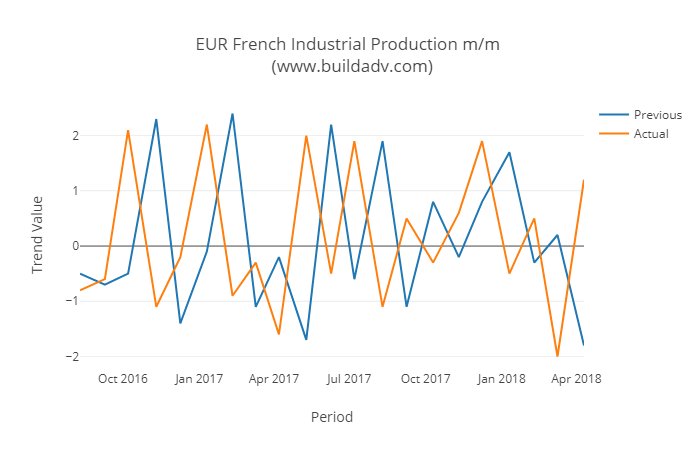
French Industrial Production m/m is reported at 1.2% which came in higher than the previous release at -1.8%The French Industrial Production m/m data released at 1.2% which is lower than the expected value at 1.5%. The mean for " French Industrial Production m/m " over the last 21 releases has been 0.1. The current released data is greater than the mean of the last 21 releases. See the trends below between the past and actual release.
Given the economy and inflation starting to build up, EUR can see some traction in the coming weeks. There was mild negativity in EUR area due to under par data for Jan and February but that may be behind us. More importantly inflation is on a trend which is moving higher and if its gets closer to 2%, we will see a move by ECB to normalise.
EUR COT reports
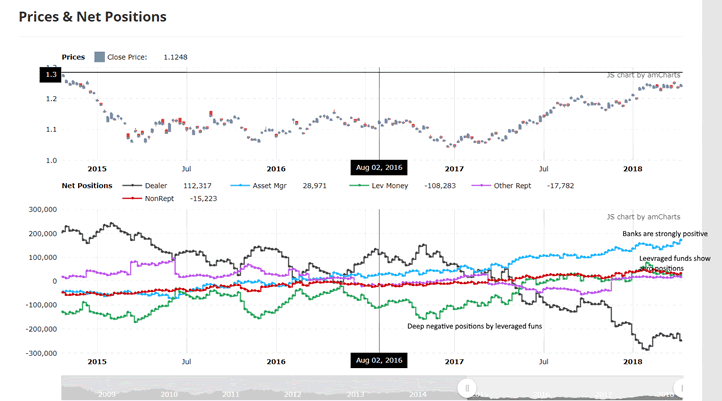
The EUR commitment of traders reports from cftc show the build of positions in EUR contracts. The leveraged money was deeply negative in 2014 but now are slightly positive. They still are not overweight the EUR and hence leaves a lot of room for EURUSD to run higher. At same time the asset category which include large institutions are strongly positive. All in all we see EUR to march higher despite the negativity surrounding it.
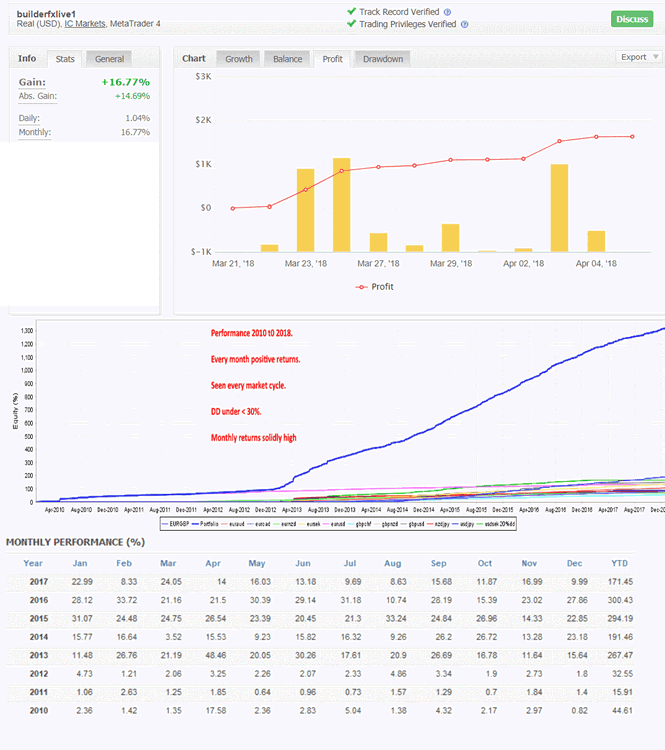
We run a high quality and precision investment firm at buildadv.com. Our trade copier has notched up an impressive return since the launch to clients. It has a rich history of trading since 2010. Launched in March on MT4, it is doing exceedingly well as shown below.
All you need is a MT4 broker account to trade our system. No upfront fees or upfront risk. Feel free to contact us and we will set you up if you have all the details
Conclusion:
We see EUR, GBP and YEN appreciating against the USD over the next 6 weeks. We also see stock markets falling back to test 2530 which is the 2018 lows. The breakout at 2670 can be termed as false. Volume data was unimpressive and we see high probability of strong correction.
By Buildadv
About Buildadv:
Buildadv is a investment management firm. We specialize in premium trading research, chart setups, trading insights and a forex trade copier which generates returns for MT4 trading clients. We operate the BUILDFX Trading system which has a rich history of over 8 years of trading history generating an average return of over 15% a month.
Email: adminsupport@buildadv.com
Website: http://buildadv.com/contact/
Copyright 2018 © Buildadv - All Rights Reserved
Disclaimer: The above is a matter of opinion provided for general information purposes only and is not intended as investment advice. Information and analysis above are derived from sources and utilising methods believed to be reliable, but we cannot accept responsibility for any losses you may incur as a result of this analysis. Individuals should consult with their personal financial advisors.
© 2005-2022 http://www.MarketOracle.co.uk - The Market Oracle is a FREE Daily Financial Markets Analysis & Forecasting online publication.