


A Stock Market Rally on Low Volume is NOT Bearish
Stock-Markets / Stock Markets 2018 Apr 17, 2018 - 04:49 PM GMTBy: Troy_Bombardia

 Conventional trading “wisdom” states that a rally that occurs on falling volume is bearish. Conventional “wisdom” states that sustainable rallies should occur on rising volume.
This simply isn’t true. As we said in Don’t use volume for trading,
Rising/falling volume isn’t a bullish sign or a bearish sign. It just is. Volume is mostly irrelevant. It doesn’t give you much of an edge in the markets.
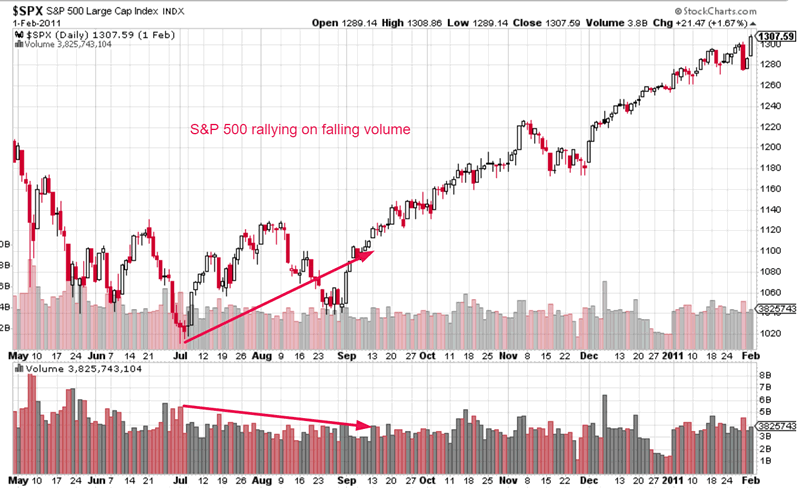
The S&P 500 is rallying on falling volume right now.
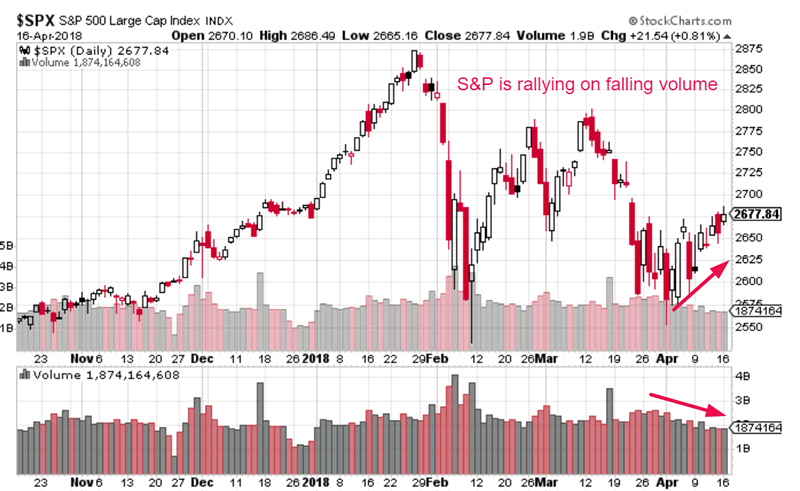
Chart courtesy of StockCharts.com
Here are the historical 10%+ corrections since 1998. (The S&P has fallen 11.8% so far a of April 2018). Notice how there is no consistent correlation between the market’s volume and its post-correction rallies.
*We don’t have volume data before 1998.
- Some post-correction rallies occured on falling falling
- Some post-correction rallies occurred on flat volume.
- Some post-correction rallies occurred on rising volume.
This means that a post-correction rally with falling volume is NOT a bearish sign. It is not an “ominous sign” for the stock market. It’s an irrelevant sign.
Here are the bottom dates for those corrections:
- February 11, 2016
- June 4, 2012
- October 4, 2011
- July 1, 2010
- August 16, 2007
- February 28, 2000
- October 18, 1999
- October 8, 1998
Let’s look at the S&P 500’s volume during each of these times.
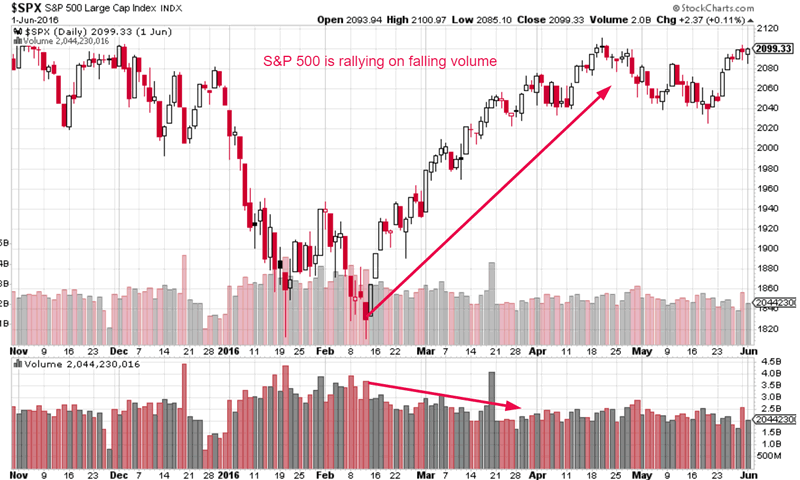
February 11, 2016
The S&P 500 ended its 15.2% “significant correction” on February 11, 2016. The subsequent post-correction rally occurred on falling volume. The stock market soared nonstop.
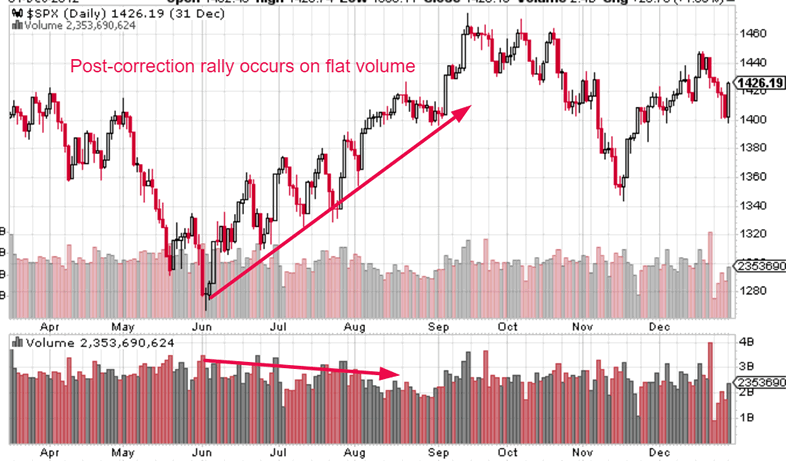
June 4, 2012
The S&P 500 ended its 10.9% “small correction” on June 4, 2012. The subsequent post-correction rally occurred on flat-falling volume. The stock market rallied in a choppy manner.
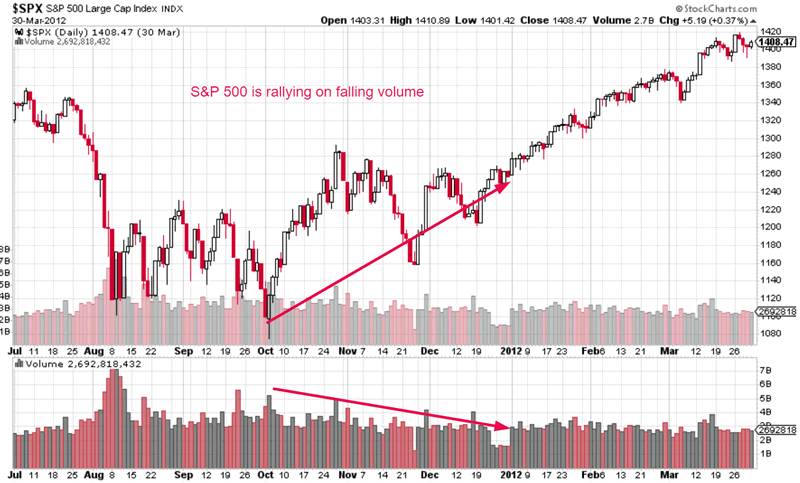
October 4, 2011
The S&P 500 ended its 21.5% “significant correction” on October 4, 2011. The subsequent post-correction rally occurred on falling volume. The stock market rallied in a very choppy manner with big waves.
July 1, 2010
The S&P 500 ended its 17.1% “significant correction” on July 1, 2010. The subsequent post-correction rally occurred on falling volume. The stock market rallied in a choppy manner.
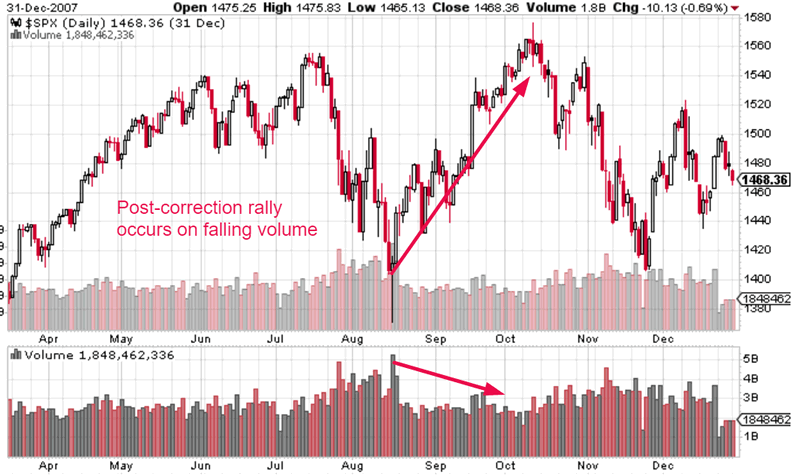
August 16, 2007
The S&P 500 ended its 11.9% “small correction” on August 16, 2007. The subsequent post-correction rally occurred on falling volume. The stock market rallied in a choppy manner.
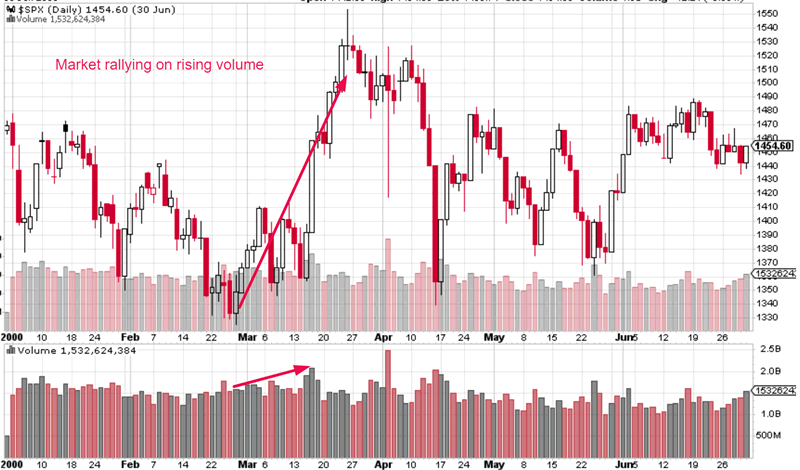
February 28, 2000
The S&P 500 ended its 10.3% “small correction” on February 28, 2000. The subsequent post-correction rally occurred on rising volume. The stock market soared to new highs very quickly.
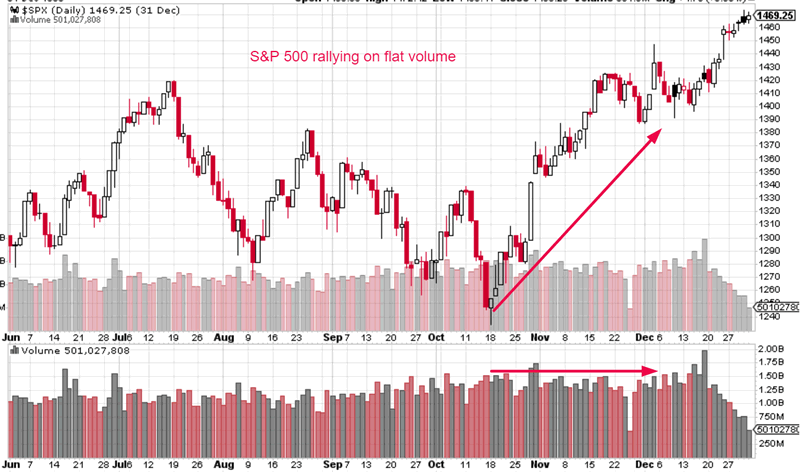
October 18, 1999
The S&P 500 ended its 13.1% “small correction” on October 18, 1999. The subsequent post-correction rally occurred on flat volume. The stock market soared nonstop.
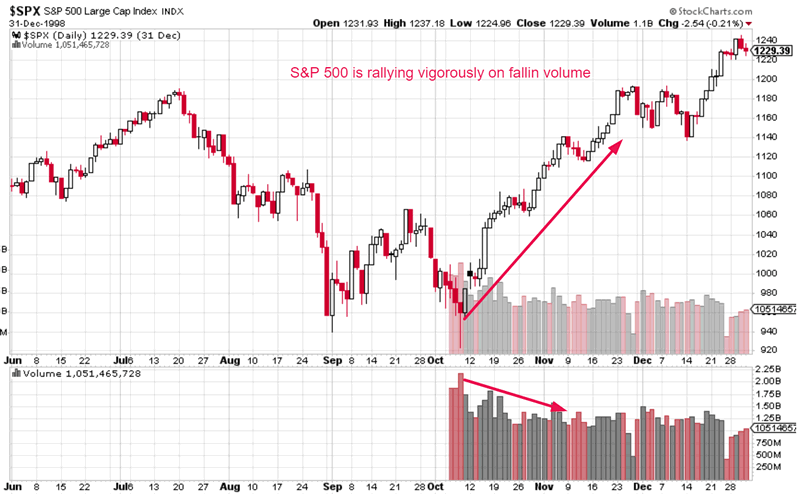
October 8, 1998
The S&P 500 ended its 22.4% “significant correction” on October 8, 1998. The subsequent post-correction rally occurred on falling volume. The stock market soared nonstop.
Conclusion
The stock market’s recent rally on falling volume is not a bearish sign for the stock market. It is an irrelevant sign for the stock market. It’s neither bullish nor bearish.
With that in mind, some short term downside risk is present. But this downside risk is limited because the medium and long term outlooks are very bullish. See this study and this study.
By Troy Bombardia
I’m Troy Bombardia, the author behind BullMarkets.co. I used to run a hedge fund, but closed it due to a major health scare. I am now enjoying life and simply investing/trading my own account. I focus on long term performance and ignore short term performance.
Copyright 2018 © Troy Bombardia - All Rights Reserved
Disclaimer: The above is a matter of opinion provided for general information purposes only and is not intended as investment advice. Information and analysis above are derived from sources and utilising methods believed to be reliable, but we cannot accept responsibility for any losses you may incur as a result of this analysis. Individuals should consult with their personal financial advisors.
© 2005-2022 http://www.MarketOracle.co.uk - The Market Oracle is a FREE Daily Financial Markets Analysis & Forecasting online publication.