


Stock Market Correction Turns Consolidation
Stock-Markets / Stock Markets 2018 Apr 23, 2018 - 09:37 AM GMTBy: Andre_Gratian

 Current Position of the Market
SPX: Long-term trend – The bull market is continuing with a top expected in the low 3000s.
Intermediate trend – The intermediate correction from 2873 should now continue until May.
Analysis of the short-term trend is done on a daily basis with the help of hourly charts. It is an important adjunct to the analysis of daily and weekly charts which discusses the course of longer market trends.
Daily market analysis of the short term trend is reserved for subscribers. If you would like to sign up for a FREE 4-week trial period of daily comments, please let me know at ajg@cybertrails.com
Correction Turns Consolidation
Market Overview
Last week, I outlined what could be a bearish end to the correction based on cyclical pressure and congestion at the 2760 level, but cautioned that it would have to be confirmed by the market action over the next few trading days. It did not take long for SPX to strike down that possible scenario as prices immediately rose above the 2670 resistance level and moved up to 2717 before reversing. It appears that I gave the 40-wk cycle bottoming in the next few weeks too much credit for the amount of downside pressure it had in store.
Conversely, it may not permit the index to exceed last week’s high before there is a retest of the recent lows. It has been suggested that SPX is morphing into a triangle formation which would be the launching platform for the final bull market high in the Fall, most likely in the low 3000s. This is what the 1810 congestive formation had suggested all along. This would also satisfy the larger structure with a wave 4 triangle before wave a 5 into the bull market top.
Near-term, the minor low of 2661 which was made on Friday could bring a brief rebound next week, but with the larger cycle bottom now in sight, we should not expect too much of an uptrend before the decline resumes..
Chart Analysis (These charts and subsequent ones courtesy of QCharts)
SPX daily chart
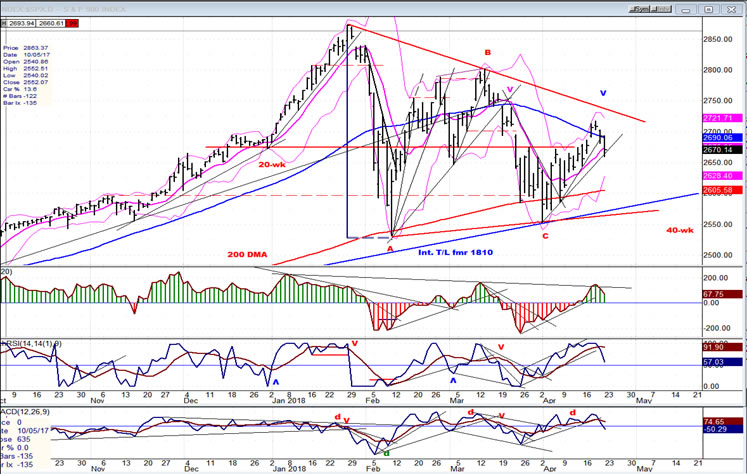
The 200 DMA and the intermediate trend line no longer coincide because I have readjusted the latter to the second low. For now, the structure remains A-B-C until we see how the rest of the correction proceeds. However, with large price swings subsiding, the rest of the correction should become a consolidation confined to the already established parameters. This would most likely convert the final structure into a triangle formation; but since other possibilities still exist, let’s wait until the correction has ended.
The rally from 2554 remained sluggish until it reached the 2670 resistance level, then picked up momentum as it broke through and quickly reached the declining 55-DMA which, although it was slightly surpassed, brought an end to the move. In the last three days, the index lost nearly 60 points, so there is still plenty of volatility remaining in the market. The decline has brought prices back to the break-out point, as well as the trend line, drawn from the 2553 low. This should provide some temporary support, but any rebound from here should be limited by the 40-wk cycle low which is rapidly approaching. The rally from 2554 failed to make it all the way to the primary downtrend line, and this is a sign that the bears are still in control, but only up to a point. They control the highs, but the bulls control the lows and that gap is narrowing. It is the reason why the correction is likely to end as a triangle formation, which is often the shape taken by a wave 4.
SPX hourly chart
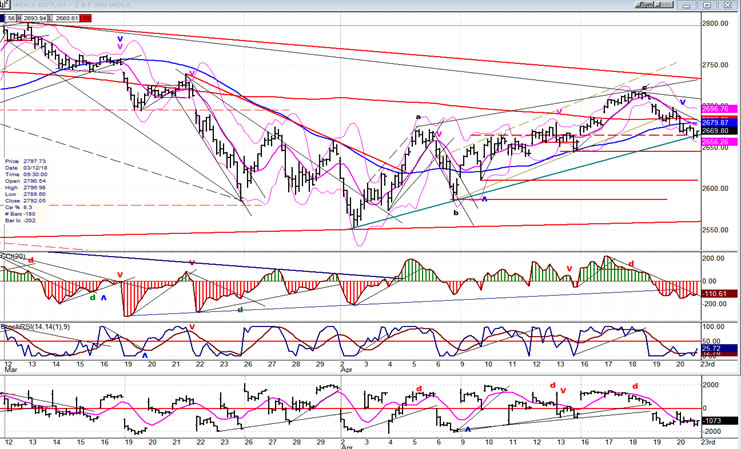
After reaching overhead resistance at 2717, SPX could go no higher and reversed even though it had a potential count to 2720. That, and its failure to make it all the way up to the principal red downtrend line, can be construed as a sign of weakness. Also, in the ensuing decline, a minor cycle due on Thursday might already have failed since after three hours of consolidation, the decline continued down to the trend line from 2554 which was breached but held, producing a small rally in Friday’s last hour of trading.
The weakness after the reversal from 2717 can be seen in the top oscillator which dipped lower than at any time since the beginning of April; but by Friday’s close, some minor positive divergence did develop in the indicator, suggesting that the index could hold for a little while above its support level (the top portion of which has already been penetrated). SPX would now have to rally nearly sixty points just to challenge the 2717 level. I am not sure there is that much bullish strength left since we are so close to the cycle low. A continuation of the decline could find at least temporary support on one of the red lines below.
Beginning to form a base for more than a few days after we enter the month of May could be indicative that we are preparing to reverse and start on our final leg of the bull market.
TRAN, SPX, IWM (daily charts)
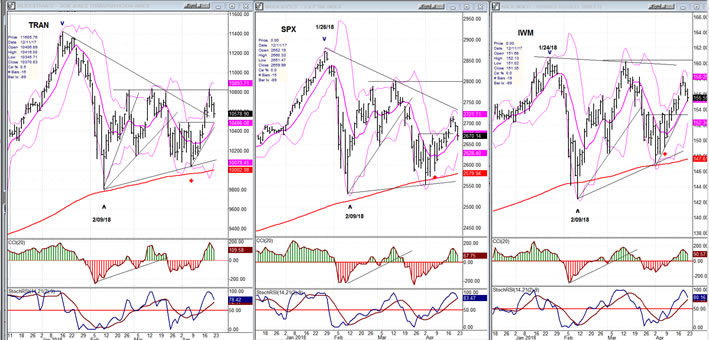
Last week, TRAN was the weakest of the three above. This week, it has rallied to the top of its corrective formation and if all three make a triangular pattern as they complete their correction, TRAN may end up with an ascending triangle formation and be the first to move higher. Since both TRAN and IWM are holding better than SPX, we can probably assume that the correction is nearly over; but it is likely that all three indexes need one more – and final – retracement before starting their next bullish trend.
UUP (dollar ETF)
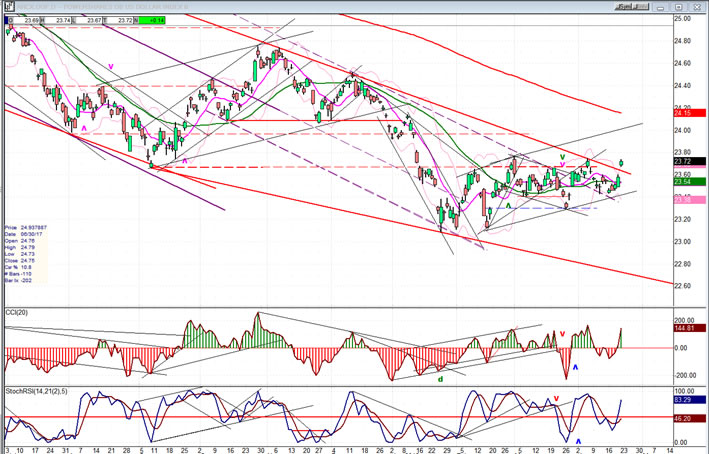
UUP has broken above its downtrend line, but I doubt if it is the beginning of a new uptrend. Instead, it may be ending wave 4 of the correction from the 24.75 top before starting 5 of 5 of the correction which started at 26.83. Very often, wave 4 trades outside of the trend line connecting the high and the top of wave 2 before starting on wave 5. This could be what UUP is experiencing.
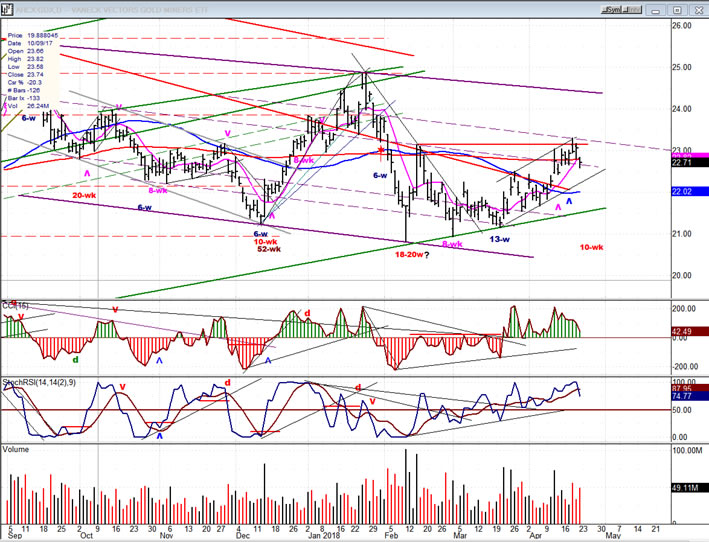
GDX (Gold miners ETF)
As long as strength remains in the dollar, it is unlikely that GDX will be able to achieve a real break-out. It has been stopped in its attempt to move to the 25-25.50 projection level by resistance encountered at a former short-term high, and it may have to wait until UUP starts on its final down phase before it can get the all clear signal.
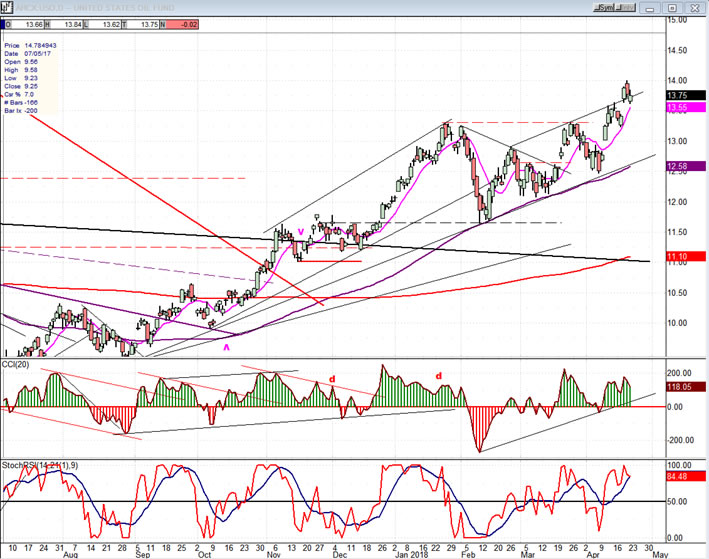
USO (United States Oil Fund)
You could not ask for a more perfect structural pattern than the one formed by USO’s uptrend from its major low, especially since, by printing 14.00, it has now reached the minimum target zone for this move. Another half-point or so is possible before ending the entire uptrend from 8.65.
Summary
SPX is nearing the time frame when the 40-wk cycle is scheduled to make its low. Prices are being squeezed more and more into a narrow range as sellers and buyers continue to define the limits of the remaining trading zone. This could result in the correction ending after having formed a large triangle which is often what structure dictates for a wave 4 pattern.
Andre
For a FREE 4-week trial, send an email to anvi1962@cableone.net, or go to www.marketurningpoints.com and click on "subscribe". There, you will also find subscription options, payment plans, weekly newsletters, and general information. By clicking on "Free Newsletter" you can get a preview of the latest newsletter which is normally posted on Sunday afternoon (unless it happens to be a 3-day weekend, in which case it could be posted on Monday).
Disclaimer - The above comments about the financial markets are based purely on what I consider to be sound technical analysis principles uncompromised by fundamental considerations. They represent my own opinion and are not meant to be construed as trading or investment advice, but are offered as an analytical point of view which might be of interest to those who follow stock market cycles and technical analysis.
Andre Gratian Archive |
© 2005-2022 http://www.MarketOracle.co.uk - The Market Oracle is a FREE Daily Financial Markets Analysis & Forecasting online publication.