


Study: Does the year-over-year change in Corporate Earnings Lead the Stock Market?
Stock-Markets / Stock Markets 2018 May 08, 2018 - 03:51 PM GMTBy: Troy_Bombardia

 I concluded that the absolute value of corporate earnings does not consistently lead the stock market in a previous study. I.e. sometimes corporate earnings fall before the stock market falls, sometimes the stock market falls before corporate earnings fall.
But what about the rate of change in corporate earnings? Does the change in corporate earnings GROWTH (i.e. second derivative of corporate earnings) lead the stock market? It appears to be the case from 1990-present.
Let’s find out.
*You can download the data here in Excel
Does the year-over-year change in earnings lead the stock market?
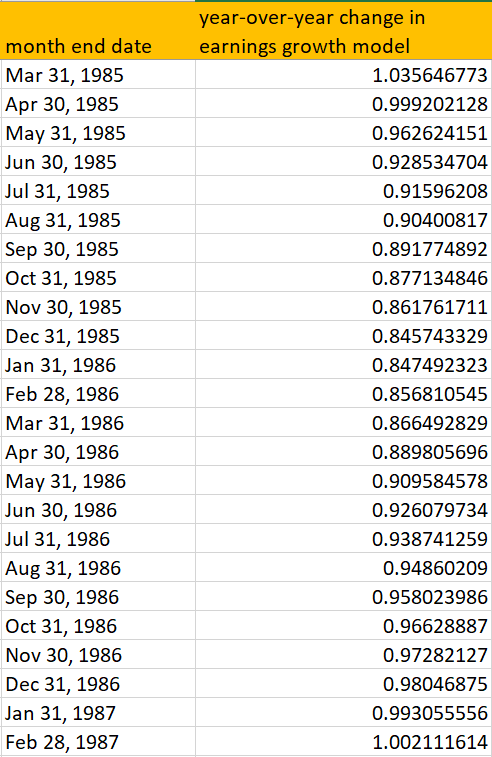
This chart demonstrates the year-over-year change in the S&P 500’s corporate earnings (updated each month).
- A value of “1” means that earnings haven’t changed from this month vs. 1 year ago.
- A value > “1” means that earnings have grown from this month vs. 1 year ago.
- A value < “1”, means that earnings have fallen from this month vs. 1 year ago.
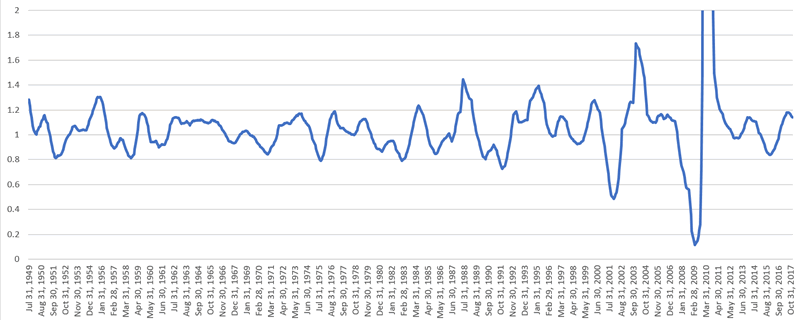
As you can see, this is NOT a good leading indicator for the stock market.
- Sometimes the year-over-year change in earnings leads the stock market. Sometimes it lags the stock market.
- The year-over-year change in earnings gives false signals.
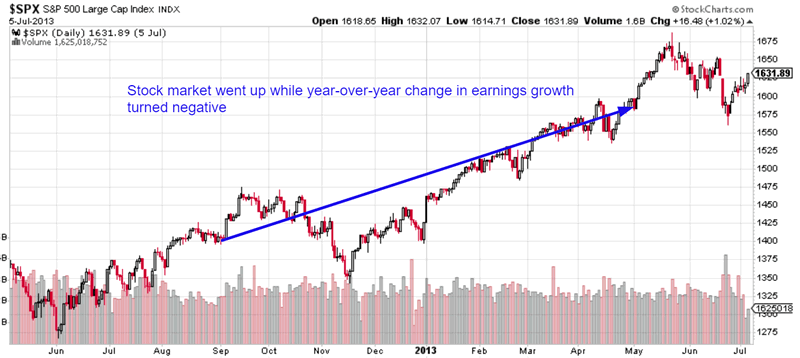
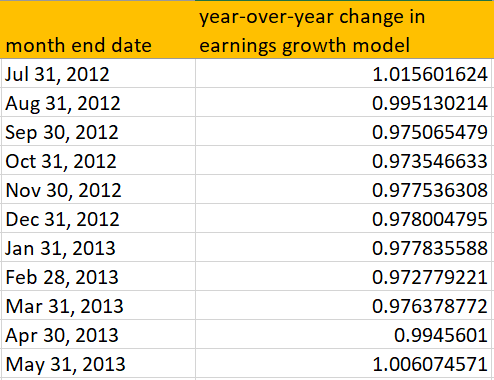
For example, the year-over-year change in earnings turned negative in August 2012 and remained negative until April 2013. The stock market went up during this period (although there was a “small correction” along the way).
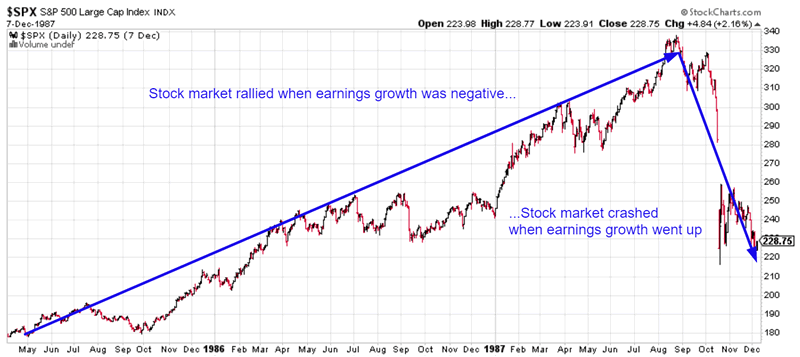
Here’s another example. The year-over-year change in earnings turned negative in April 1985 and remained negative until August 1987. The stock market went up while earnings growth was negative. When earnings growth started to rise and turned positive, the stock market CRASHED (“significant correction” of 1985).
What about the year-over-year change in inflation-adjusted earnings? Does that lead the stock market?
Does the year-over-year change in inflation-adjusted earnings lead the stock market?
This chart demonstrates the year-over-year change in the S&P 500’s inflation-adjusted earnings (updated each month).
- A value of “1” means that earnings haven’t changed from this month vs. 1 year ago.
- A value > “1” means that earnings have grown from this month vs. 1 year ago.
- A value < “1”, means that earnings have fallen from this month vs. 1 year ago.
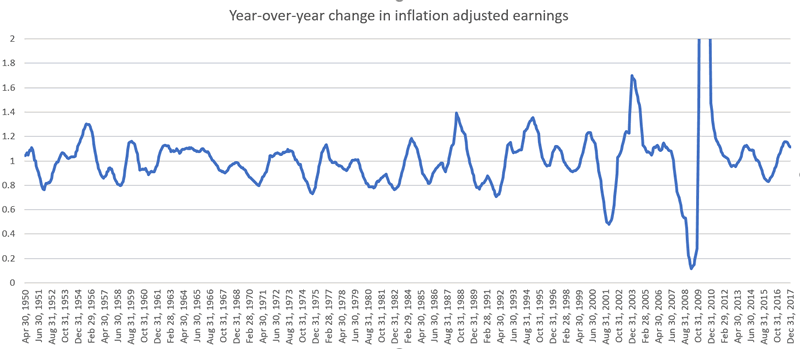
As you can see, this is even more useless as a leading indicator for the stock market. The year-over-year change in inflation-adjusted earnings frequently went down and turned negative when the stock market rallied.
In other words, this indicator is very choppy and gives a lot of false bearish signals.
Conclusion
It seems like the stock market cares more about whether earnings are increasing or decreasing than whether earnings GROWTH is increasing or decreasing.
But more importantly, it seems that corporate earnings indicators are not as useful as economic indicators for predicting the stock market’s medium-long term direction. This is why I don’t use earnings data in the Medium-Long Term Model.
By Troy Bombardia
I’m Troy Bombardia, the author behind BullMarkets.co. I used to run a hedge fund, but closed it due to a major health scare. I am now enjoying life and simply investing/trading my own account. I focus on long term performance and ignore short term performance.
Copyright 2018 © Troy Bombardia - All Rights Reserved
Disclaimer: The above is a matter of opinion provided for general information purposes only and is not intended as investment advice. Information and analysis above are derived from sources and utilising methods believed to be reliable, but we cannot accept responsibility for any losses you may incur as a result of this analysis. Individuals should consult with their personal financial advisors.
© 2005-2022 http://www.MarketOracle.co.uk - The Market Oracle is a FREE Daily Financial Markets Analysis & Forecasting online publication.