


Stock Market Study: How Long After a 10%+ “Small Correction” to Make New Highs?
Stock-Markets / Stock Markets 2018 May 27, 2018 - 06:06 PM GMTBy: Troy_Bombardia

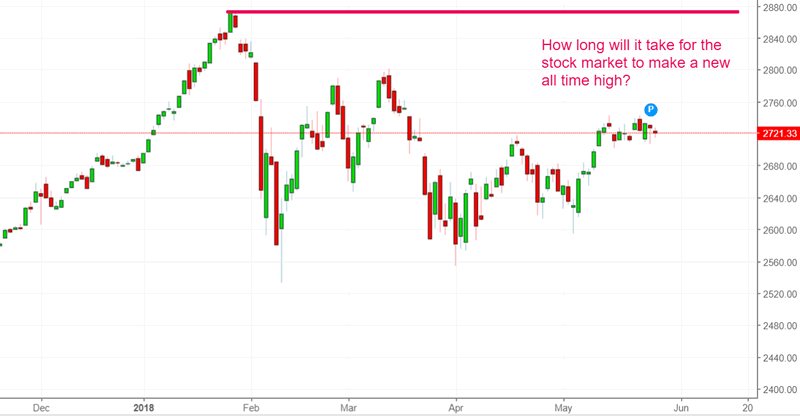
 The S&P 500 made a 10%+ “small correction” from January- February 2018. In a previous study I looked at how long it usually takes for the stock market to go from its correction bottom to a new all time high.
In today’s study I’m going to look at how long it usually takes for the S&P 500 to go from an old all-time high to making a new all time high.
Here are the historical 10%+ “small corrections”, as defined by the Medium-Long Term Model.
- April 2, 2012
- July 16, 2007
- January 3, 2000
- July 19, 1999
- October 8, 1997
- April 14, 1997
- May 23, 1996
- January 3, 1990
- August 27, 1986
- September 25, 1967
- June 29, 1965
- September 23, 1955
Here’s how long it took for the S&P to go from a pre-correction high to a new post-correction high.
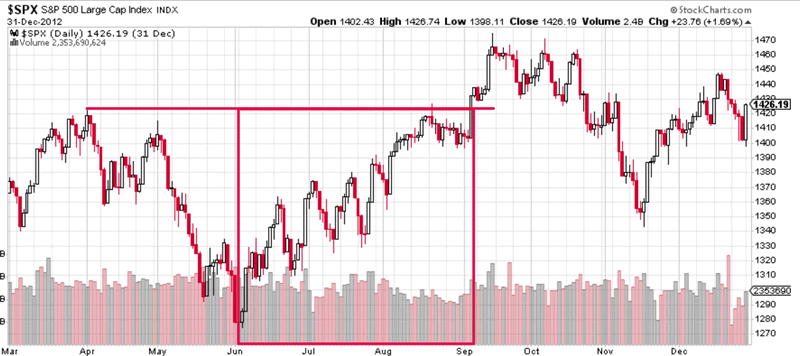
April 2, 2012
It took 98 days for the S&P 5 make a new all time high.
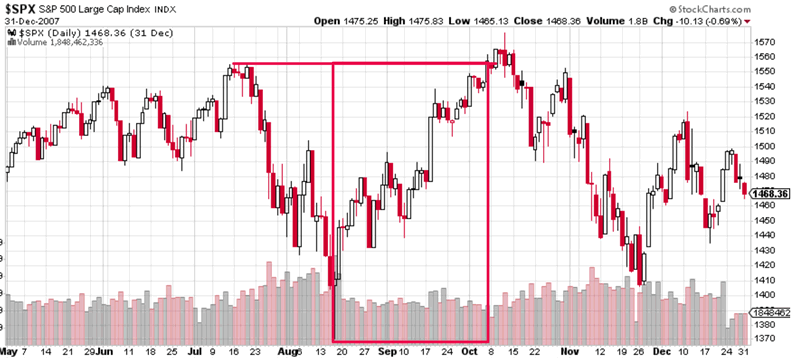
July 16, 2007
It took 58 days for the S&P to make new highs.
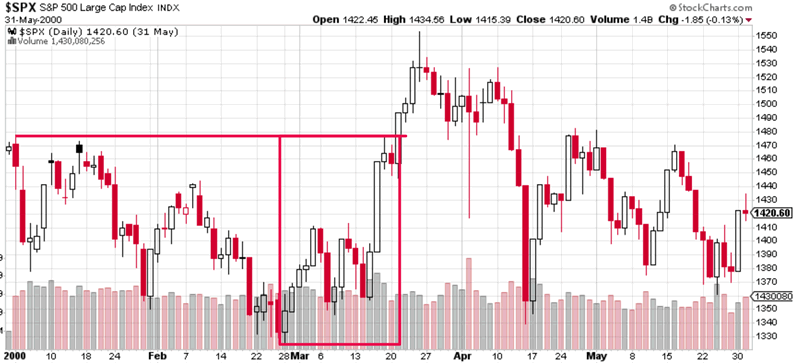
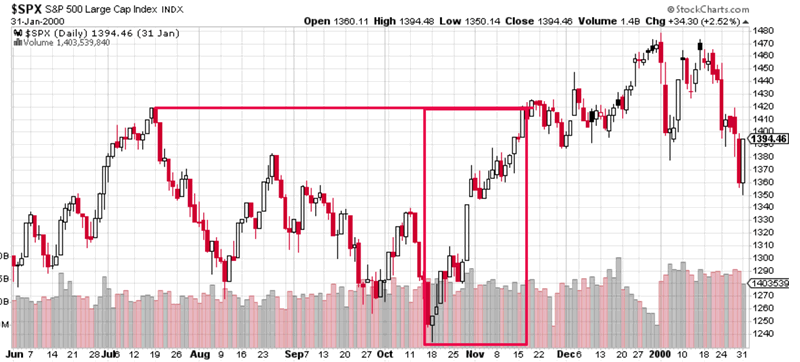
January 3, 2000
It took 54 days for the S&P to make new highs.
July 19, 1999
It took 85 days for the S&P to make new highs.
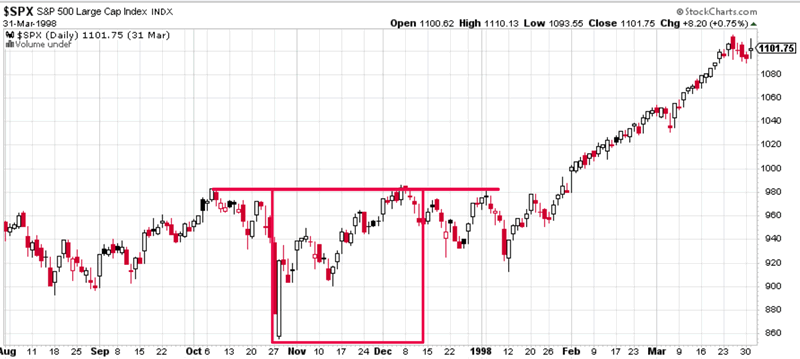
October 8, 1997
It took 40 days for the S&P to make new highs.
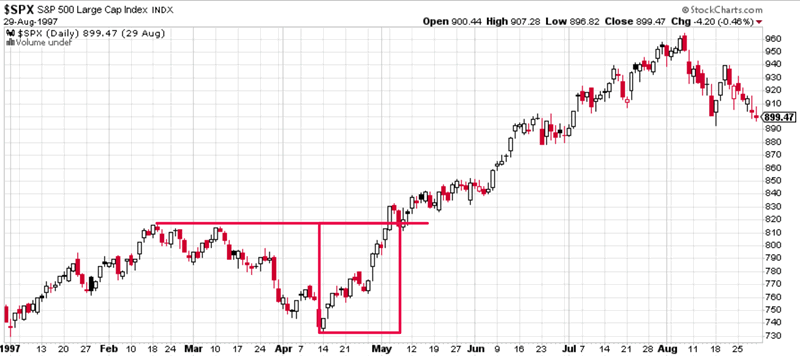
February 19, 1997
It took 52 days for the S&P to make new highs.
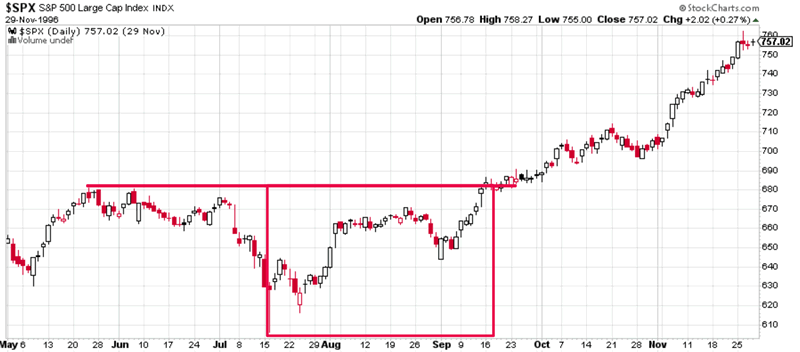
May 23, 1996
It took 78 days for the S&P to make new highs.
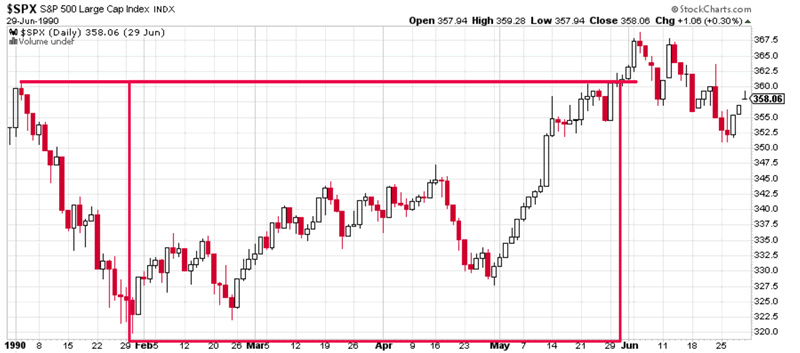
January 3, 1990
It took 102 days for the S&P to make new highs.
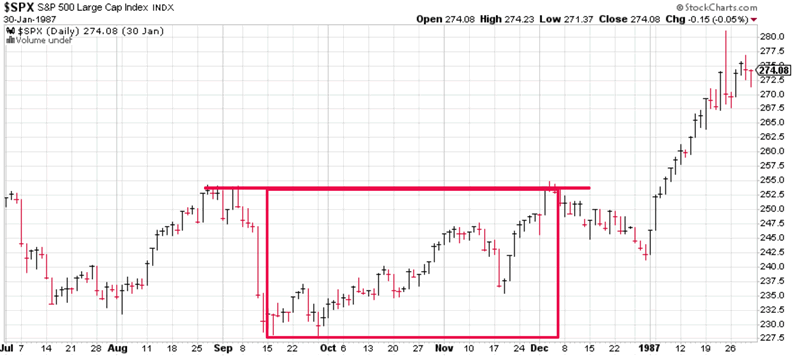
August 27, 1986
It took 68 days for the S&P to make new highs.
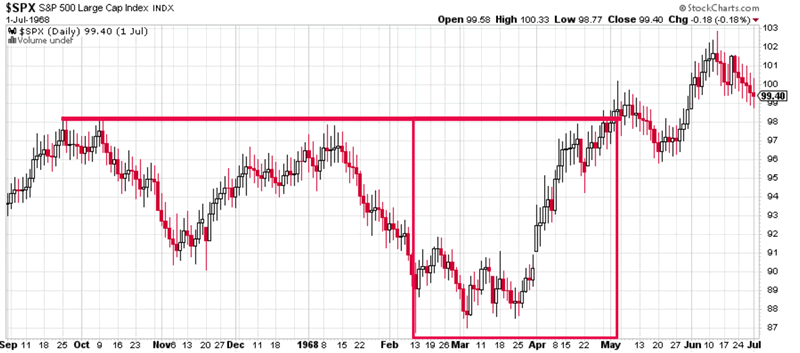
September 25, 1967
It took 147 days for the S&P to make new highs.
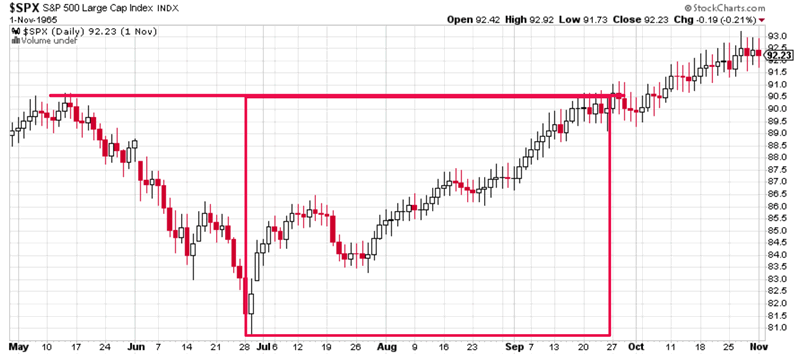
May 13, 1965
It took 92 days for the S&P to make new highs.
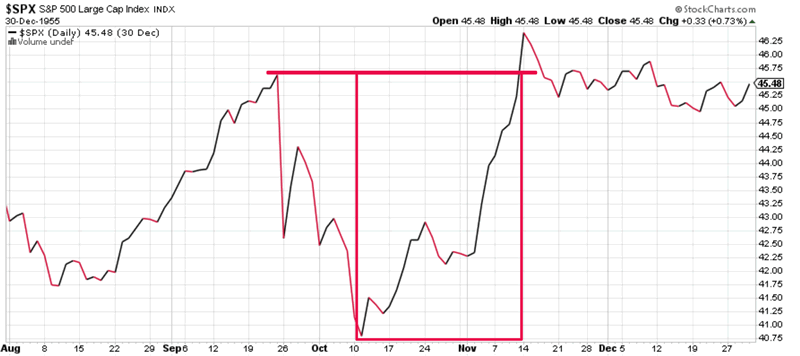
September 23, 1955
It took 35 days for the S&P to make new highs.
Conclusion
Here’s how long it took historical 10%+ “small” corrections to make a new high.
- 0 – 21 days (1 month):
- 22 – 42 days (2 months): 11
- 43 – 63 days (3 months): 1111
- 64 – 84 days (4 months): 11
- 85 -105 days (5 months): 111
- 106 – 126 days (6 months):
- More than 6 months: 1
As you can see, it usually took 2 – 5 months for the S&P 500 to make a new all time high. There was one exception that took 7 months.
This study suggests that the S&P 500 will probably make a new high by the end of June 2018 (5 months from January 2018). It should definitely make a new high by the end of August 2018 (7 months from January 2018).
Read Stocks on May 26, 2018: weekend outlook
By Troy Bombardia
I’m Troy Bombardia, the author behind BullMarkets.co. I used to run a hedge fund, but closed it due to a major health scare. I am now enjoying life and simply investing/trading my own account. I focus on long term performance and ignore short term performance.
Copyright 2018 © Troy Bombardia - All Rights Reserved
Disclaimer: The above is a matter of opinion provided for general information purposes only and is not intended as investment advice. Information and analysis above are derived from sources and utilising methods believed to be reliable, but we cannot accept responsibility for any losses you may incur as a result of this analysis. Individuals should consult with their personal financial advisors.
© 2005-2022 http://www.MarketOracle.co.uk - The Market Oracle is a FREE Daily Financial Markets Analysis & Forecasting online publication.