


What Happens Next when the Stock Market Consolidates in a Very Narrow Range
Stock-Markets / Stock Markets 2018 May 30, 2018 - 02:15 PM GMTBy: Troy_Bombardia

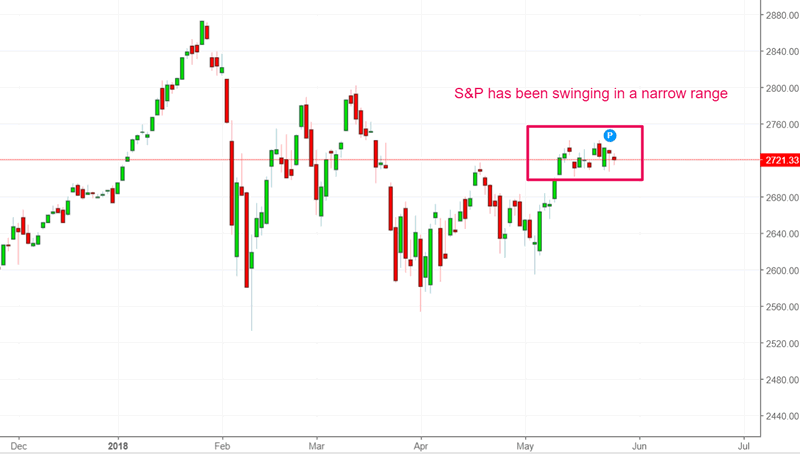
 The U.S. stock market (S&P 500) has been swinging in a very narrow range over the past 12 days. The range is less than 1% when using CLOSE prices.
Oddstats did a study demonstrating what happens next when the S&P 500 swings sideways in a very narrow range for 12 days. He failed to put things into context, which caused him to overestimate how bullish his study was.
My study will correct the error that he made by adding context.
*Putting things into context is very important. The same indicator/study can result in different conclusions when market stages are different.
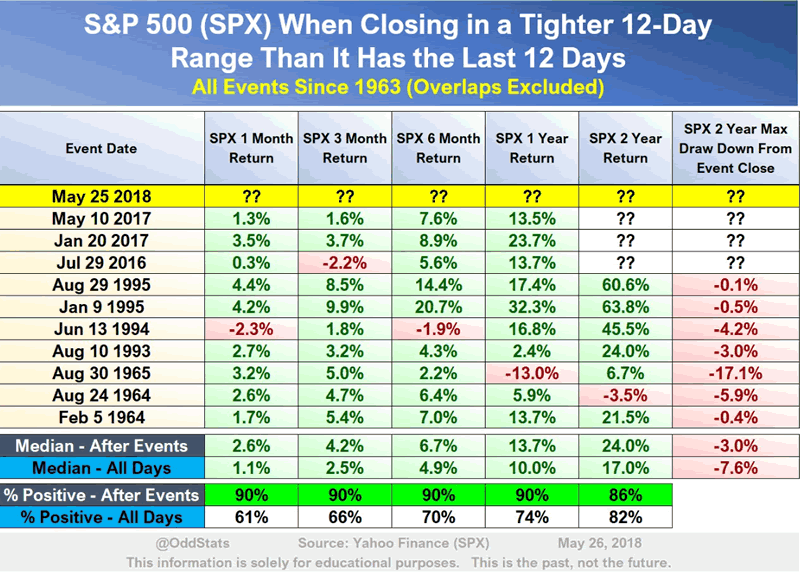
As you can see, a market that consolidates sideways is a short term, medium term, AND long term bullish sign (according to Oddstats’ study). But this fails to recognize that there is a fundamental difference between:
- A market that consolidates sideways when it’s making all time highs (i.e. grinding higher), and..
- A market that consolidates sideways when it’s still far from making new highs.
Studies that have no context aren’t very useful for trading the future. A market that consolidates sideways when it’s making new highs will naturally have a higher change of going higher in the future. “Grind higher” patterns are inherently bullish for the stock market. Stock market tops and downtrends are marked by increased volatility.
The stock market today fits the 2nd context: a market that consolidates sideways when it’s still far from making new highs. The S&P 500 is still more than 5% below its all time high. It’s uncommon for the stock market’s volatility to be this low when it hasn’t made a new high. The market usually experiences higher than normal volatility when it hasn’t made a new high.
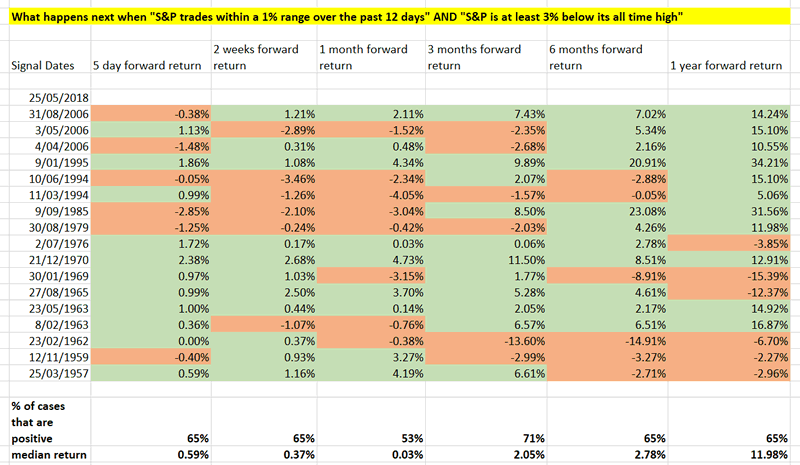
That’s why I changed the parameters for Oddstats’ study. My study looks at what happens next when:
The S&P 500 closed in a 1% range over the past 12 days, AND…
The S&P 500 is at least 3% below its all time high
Here are the study’s results. Notice that the short term, medium term, and long term all go from being decidedly bullish (in Oddstats’ study) to being less bullish (in my study).
Here’s the Excel file for this study. Data and equations are included.
Conclusion
My study demonstrates that the stock market’s short term, medium term, and long term have a slight bullish bias. This study is not an extremely bullish sign for the stock market.
In the meantime, the Medium-Long Term Model and 6 other trading models are bullish on the stock market right now. This TIME cycle study demonstrates that the stock market will probably make a new high before summer 2018 is over.
By Troy Bombardia
I’m Troy Bombardia, the author behind BullMarkets.co. I used to run a hedge fund, but closed it due to a major health scare. I am now enjoying life and simply investing/trading my own account. I focus on long term performance and ignore short term performance.
Copyright 2018 © Troy Bombardia - All Rights Reserved
Disclaimer: The above is a matter of opinion provided for general information purposes only and is not intended as investment advice. Information and analysis above are derived from sources and utilising methods believed to be reliable, but we cannot accept responsibility for any losses you may incur as a result of this analysis. Individuals should consult with their personal financial advisors.
Troy_Bombardia Archive |
© 2005-2022 http://www.MarketOracle.co.uk - The Market Oracle is a FREE Daily Financial Markets Analysis & Forecasting online publication.