Most Popular
1. It’s a New Macro, the Gold Market Knows It, But Dead Men Walking Do Not (yet)- Gary_Tanashian
2.Stock Market Presidential Election Cycle Seasonal Trend Analysis - Nadeem_Walayat
3. Bitcoin S&P Pattern - Nadeem_Walayat
4.Nvidia Blow Off Top - Flying High like the Phoenix too Close to the Sun - Nadeem_Walayat
4.U.S. financial market’s “Weimar phase” impact to your fiat and digital assets - Raymond_Matison
5. How to Profit from the Global Warming ClImate Change Mega Death Trend - Part1 - Nadeem_Walayat
7.Bitcoin Gravy Train Trend Forecast 2024 - - Nadeem_Walayat
8.The Bond Trade and Interest Rates - Nadeem_Walayat
9.It’s Easy to Scream Stocks Bubble! - Stephen_McBride
10.Fed’s Next Intertest Rate Move might not align with popular consensus - Richard_Mills
Last 7 days
The Stock Market Bear / Crash indicator Window - 9th Mar 25
Big US Tech Stocks Fundamentals - 9th Mar 25
No Winners When The Inflation Balloon Pops - 9th Mar 25
Stocks, Crypto and Housing Market Waiting for Trump to Shut His Mouth! - 27th Feb 25
PepeCoin (PEPE): Anticipating Crypto Reversals using Elliott Waves - 27th Feb 25
Audit the Fed, Audit Fort Knox, Audit Everything - 27th Feb 25
There Are Some Bullish Indicators in the Silver Market - 27th Feb 25
These Metrics Identify Only 10 AI Related Stocks That Are Undervalued - 27th Feb 25
Stocks, Bitcoin, Gold and Silver Markets Brief - 18th Feb 25
Harnessing Market Insights to Drive Financial Success - 18th Feb 25
Stock Market Bubble 2025 - 11th Feb 25
Fed Interest Rate Cut Probability - 11th Feb 25
Global Liquidity Prepares to Fire Bull Market Booster Rockets - 11th Feb 25
Stock Market Sentiment Speaks: A Long-Term Bear Market Is Simply Impossible Today - 11th Feb 25
A Stock Market Chart That’s Out of This World - 11th Feb 25
These Are The Banks The Fed Believes Will Fail - 11th Feb 25
S&P 500: Dangerous Fragility Near Record High - 11th Feb 25
Stocks, Bitcoin and Crypto Markets Get High on Donald Trump Pump - 10th Feb 25
Bitcoin Break Out, MSTR Rocket to the Moon! AI Tech Stocks Earnings Season - 10th Feb 25
Liquidity and Inflation - 10th Feb 25
Gold Stocks Valuation Anomaly - 10th Feb 25

Market Oracle FREE Newsletter

How to Protect your Wealth by Investing in AI Tech Stocks

HUI Gold Stocks Critical Juncture

Commodities / Gold and Silver Stocks 2018 Jul 06, 2018 - 12:57 PM GMT

By: Rambus_Chartology

Commodities

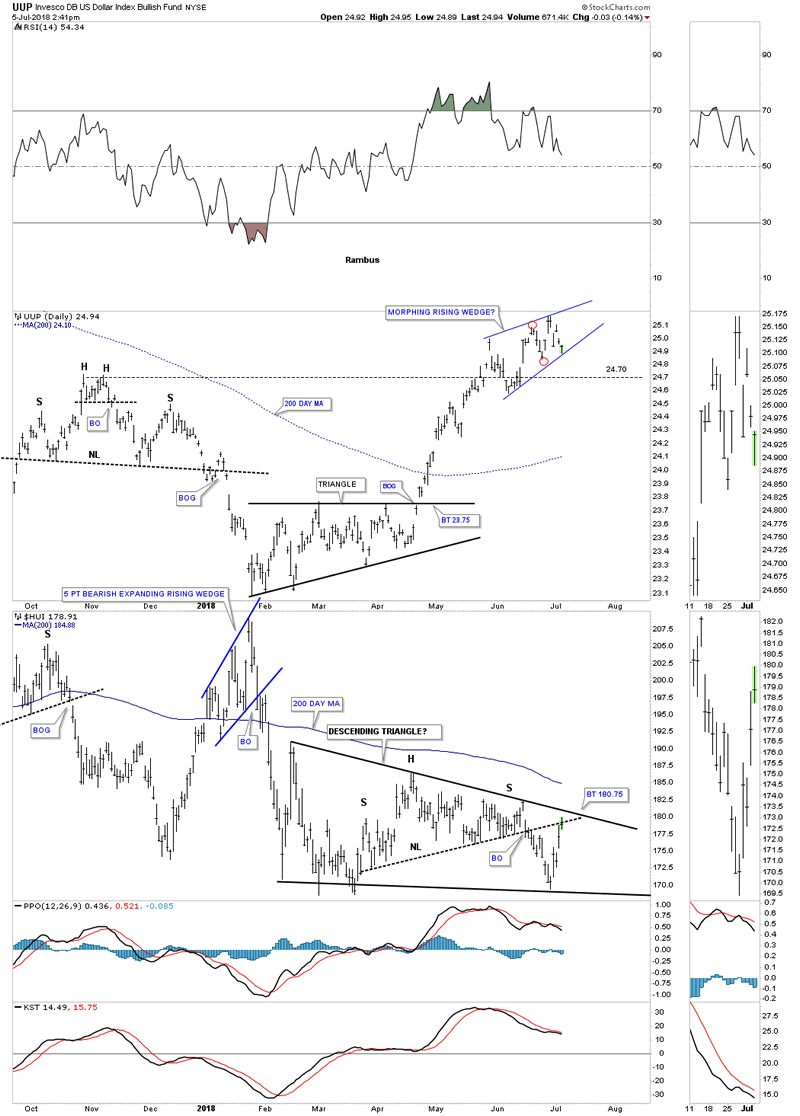
The HUI along with most of the other PM stock indexes are at a critical point right here and now. Below is a combo chart we’ve following which has the UUP (The US Dollar Index ETF) on top and the HUI on the bottom. The UUP is building out a potential morphing bullish rising wedge consolidation pattern which would most likely give the PM complex some headwind if the price action breaks out top side. On the other hand if the rising wedge breaks down then the PM complex should have a strong tailwind at their backs. If the HUI can breakout above the top rail of its descending triangle that would be very bullish for the PM complex. As you can see the HUI and the UUP are trading at a critical inflection point right here.


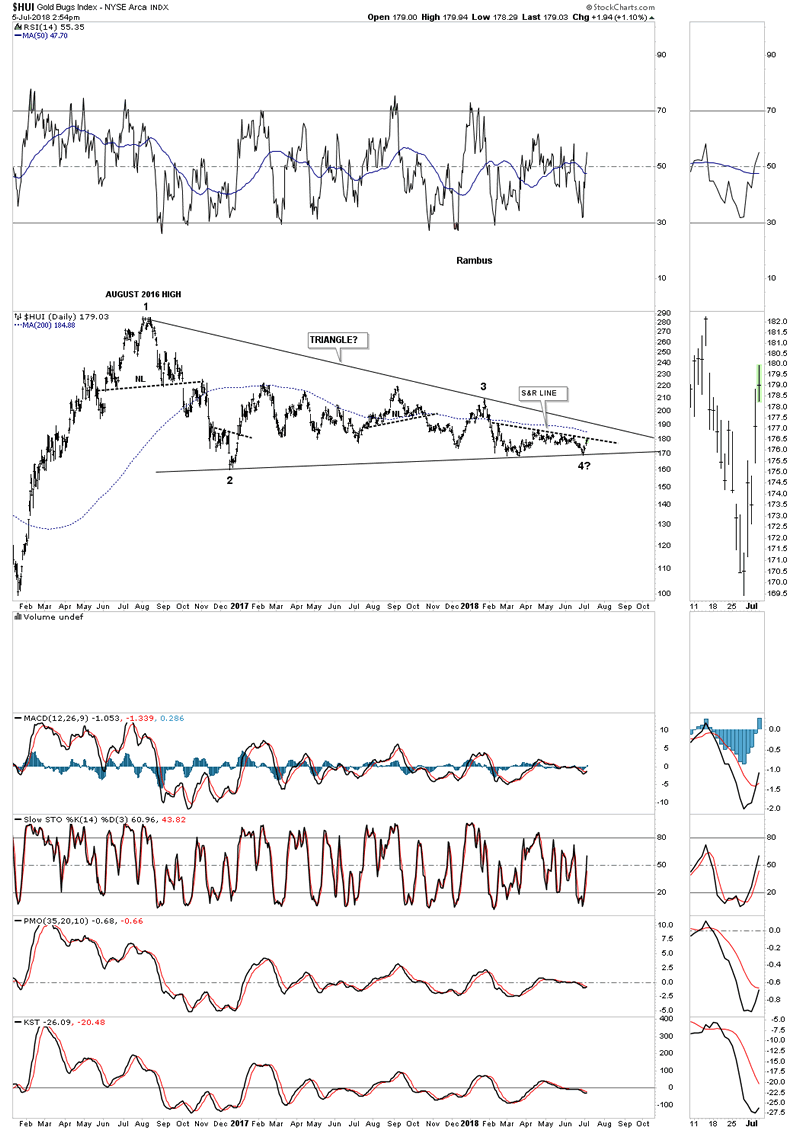
This next chart for the HUI is a long term daily look. If the HUI is putting in a long term bottom the perfect scenario would be to see the HUI breakout above the S&R line which is the top rail on the triangle above. Then maybe a ping pong move between the S&R line and the top rail of the 2 year triangle followed by a big breakout gap above the two year triangle which would then complete the fourth reversal point. From a Chartology perspective that would be the most bullish outcome we could expect. Let the games continue.

All the best

Gary (for Rambus Chartology)

http://rambus1.com

FREE TRIAL - http://rambus1.com/?page_id=10

© 2018 Copyright Rambus- All Rights Reserved

Disclaimer: The above is a matter of opinion provided for general information purposes only and is not intended as investment advice. Information and analysis above are derived from sources and utilising methods believed to be reliable, but we cannot accept responsibility for any losses you may incur as a result of this analysis. Individuals should consult with their personal financial advisors.

Rambus Chartology Archive

© 2005-2022 http://www.MarketOracle.co.uk - The Market Oracle is a FREE Daily Financial Markets Analysis & Forecasting online publication.


Post Comment

Only logged in users are allowed to post comments. Register/ Log in