


SKEW has Spiked. What This Means for Stocks
Stock-Markets / Stock Markets 2018 Jul 24, 2018 - 10:59 AM GMTBy: Troy_Bombardia

 The CBOE’s SKEW Index measures potential risk for the financial markets over the next 30 days. When the SKEW Index spikes, conventional “wisdom” assumes that there’s a greater chance of a “black swan” event occurring in the financial markets.
The SKEW Index typically ranges from 100 to 150. The higher the value, the greater the chance of a “black swan” event.
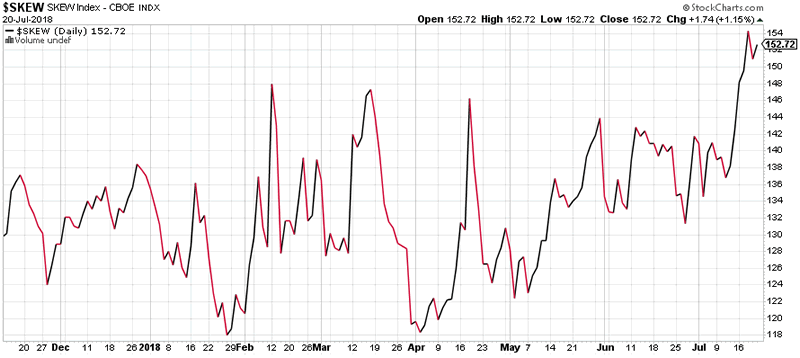
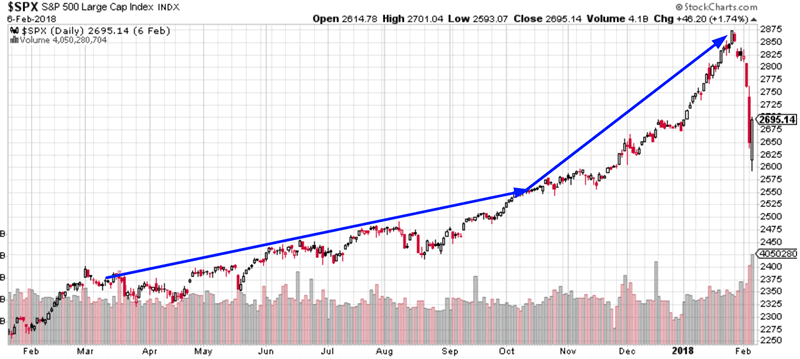
The SKEW Index has spiked recently.
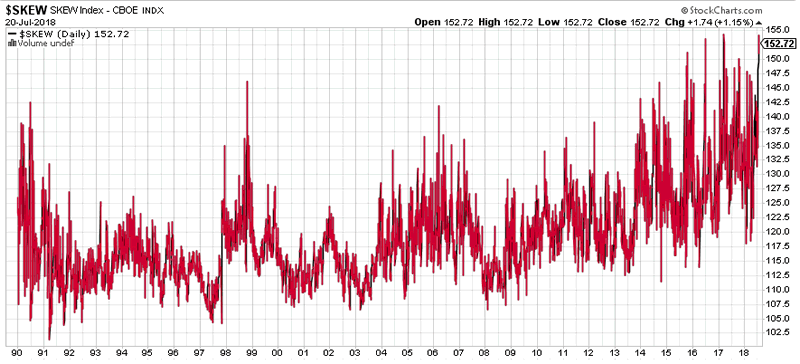
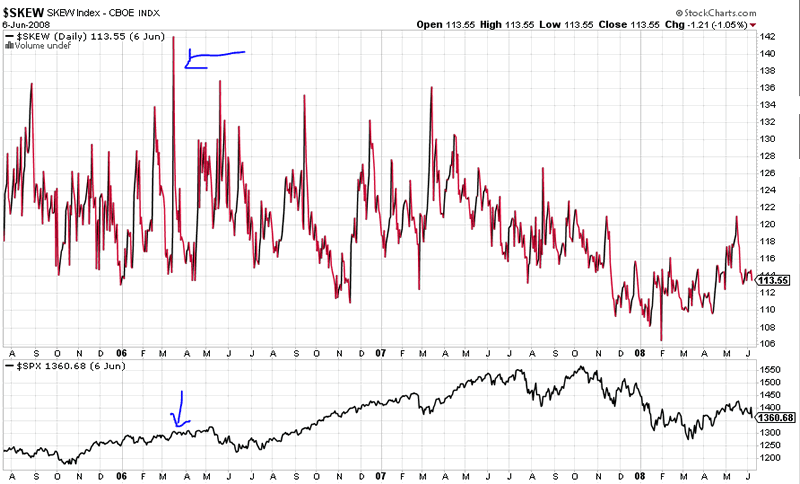
SKEW has existed since 1990. As you can see, this indicator has plenty of problems. SKEW spikes aren’t consistently bearish for the stock market.
*We define spikes in “SKEW” as readings above 140.
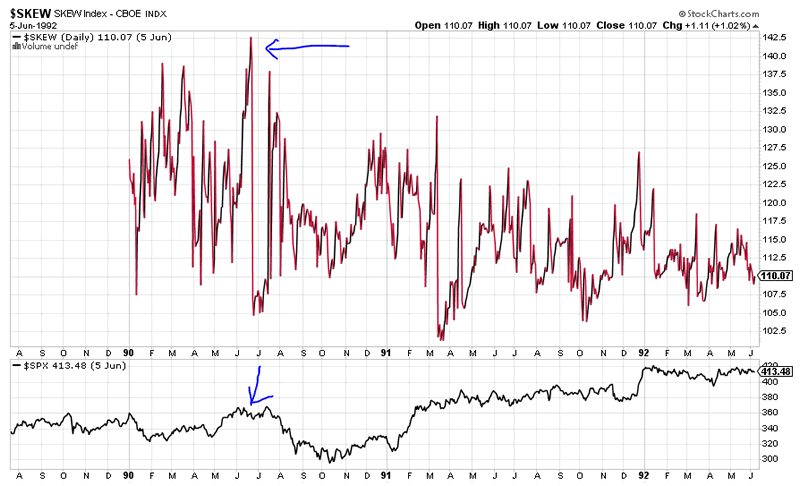
It spiked in June 1990, just before the stock market’s “big correction” which began in July. This SKEW spike predicated the decline in stocks.
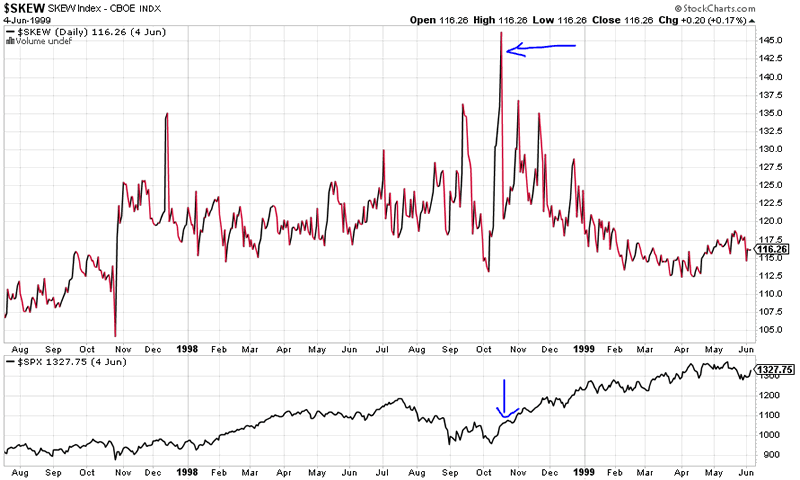
SKEW spiked in October 1998, AFTER the S&P 500 completed its “big correction” and had already bottomed.
SKEW spiked in March 2006. The S&P 500 continued to rally over the next 1.5 years, although there were “small corrections” along the way.
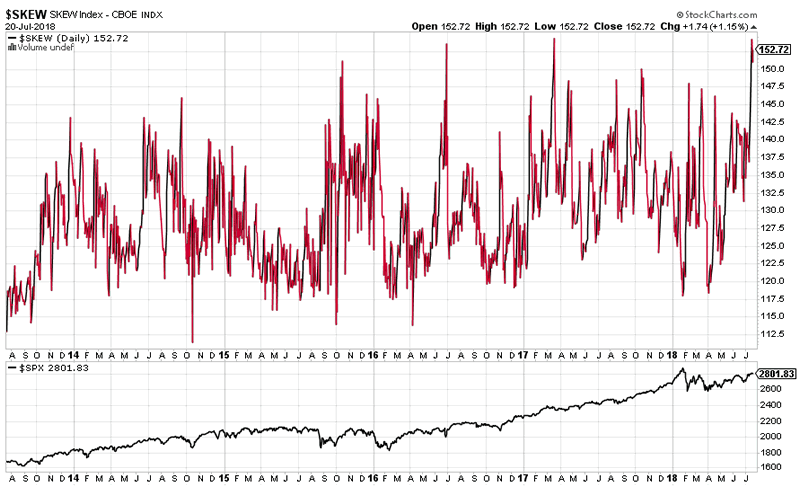
2014-present
SKEW has been consistently higher from 2014-present. The SKEW’s track record as a bearish sign is not good. SKEW has been consistently higher while the S&P 500 has trended higher.
Readings above 150
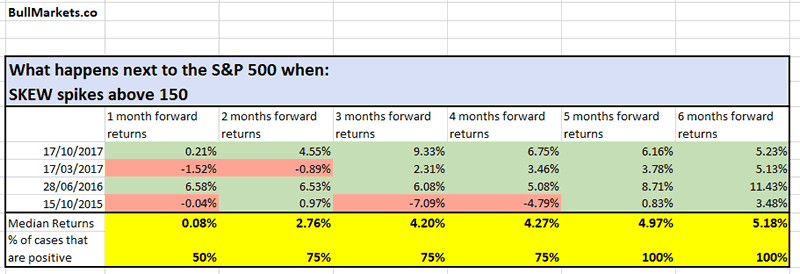
The SKEW Index is currently above 150. There have only been 4 other times in which SKEW exceeded 150. The S&P 500 typically went higher in the next few months when SKEW spiked.
October 15, 2015
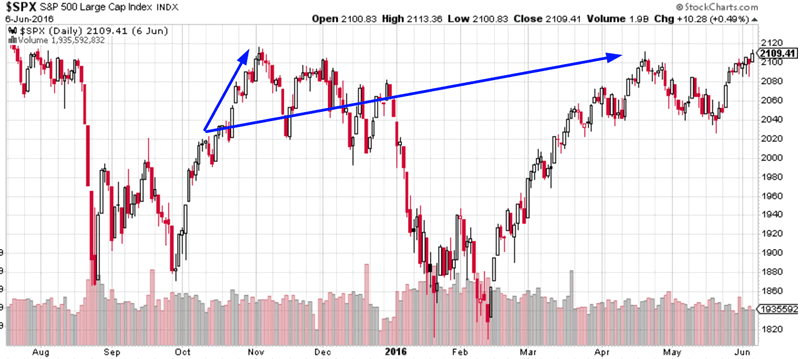
June 28, 2016
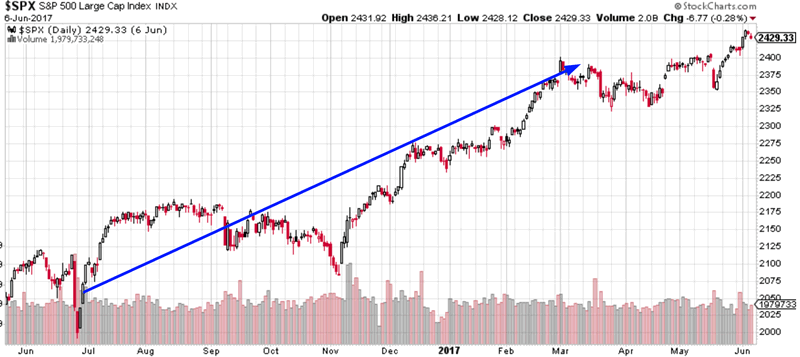
March 17, 2017
October 17, 2017
As you can see, stocks go up in 5-6 months.
Conclusion
A lot of financial “wisdom” and widely accepted beliefs are wrong when looked at in the light of data. One of these is SKEW, which spiked recently. A spike in SKEW is not consistently bearish for the stock market.
Click here for more market studies.
By Troy Bombardia
I’m Troy Bombardia, the author behind BullMarkets.co. I used to run a hedge fund, but closed it due to a major health scare. I am now enjoying life and simply investing/trading my own account. I focus on long term performance and ignore short term performance.
Copyright 2018 © Troy Bombardia - All Rights Reserved
Disclaimer: The above is a matter of opinion provided for general information purposes only and is not intended as investment advice. Information and analysis above are derived from sources and utilising methods believed to be reliable, but we cannot accept responsibility for any losses you may incur as a result of this analysis. Individuals should consult with their personal financial advisors.
© 2005-2022 http://www.MarketOracle.co.uk - The Market Oracle is a FREE Daily Financial Markets Analysis & Forecasting online publication.