


Stock Investor Batten Down The Hatches, Mates!
Stock-Markets / Stock Markets 2018 Oct 27, 2018 - 10:18 AM GMTBy: Chris_Vermeulen

 Get ready for some crazy price trends in the US markets as investors react to earnings, housing data and overall re-evaluations of future objectives. As we warned on September 17 with this post and on October 1 with this post, we believed the future Q3 earnings weeks and the 2~4 weeks leading into the US Mid-term elections could be very volatile. We even suggested a 5~8% price correction was expected to start after September 21~24.
What we did not expect is the Federal Reserve to raise rates, again, on September 26 – just days before the Q3 Earnings season actually started. Our price models for the Fed Funds Rates have suggested that any move above 2% FFR would put pricing pressures on homes and other assets. This research we completed was first published in 2015 here. This was the first time we illustrated our Fed Funds Rate Adaptive Learning modeling systems results. The chart within this article that shows that our model expected the US Fed to begin increasing interest rates in 2014~2015 to levels near 0.75~1.25. From that point, a gradual increase towards 2.0 was expected prior to 2018~19. Our price modeling system then expected a decrease in the FFR from 2.0% to between 1.5~1.75%.

The reason our model expected this decrease in the FFR near current time is because the balance between growth of asset values, credit expansion and consumer’s ability to navigate efficiently within these constructs becomes very constrained above 2%. In other words, as soon as the US Fed raising rates above 2%, they risk blowing holes in the economic recovery simply because it will outpace consumers ability to borrow and repay in an efficient manner.
We continue to believe this is the root of what is transpiring in the US Equity markets currently as a crush or reality has hit traders and investors as the housing, trade, Fed and other data is hitting the news wires. So far, the earnings release have not been anything but a success when you look at the real data. Nearly 75%+ of the total earnings announced as I write this post have been positive. Yet, the markets collapsed on news related data and home sales data. With more of this data streamed into the news cycle, we can only expect one thing to happen – a continued washout or price near recent lows or slightly lower as investors continue to digest this data and react to perceived weakness.
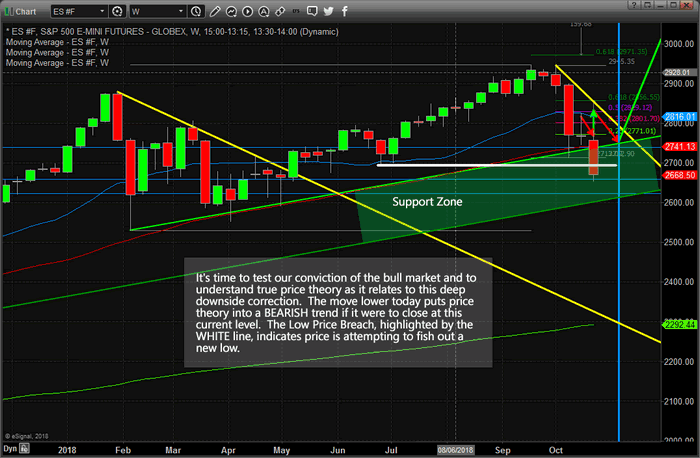
We urge you to understand the longer-term perspective of the markets and to understand true price theory as it relates to actual price highs and lows. Right now, all indications are that we have entered a deeper price correction that has initiated an intermediate term bearish trend. As of the close of Wednesday, Oct 24, price has breached recent critical price lows that has initiated this new intermediate bearish price trend. If price can’t recover above these levels before the end of this week, then we will have a confirmed intermediate bearish price trend. Yet, the ultimate low from February 2018 is still active as key support and a key price level that would need to be breached before we could call this a “new bear market trend”. Right now this is just a price correction – yes, a DEEP price correction. Those February 2018 lows are the ultimate test for a new bearish trend to setup.
This Weekly ES chart, below, helps to put everything into perspective in terms of what we are actually seeing transpire in the markets. If you have been following our analysis, we’ve called for the markets to move lower heading into a November 8~12 ultimate price bottom before turning around and heading much higher throughout the end of this year and early into 2019. The GREEN support zone is part of our key analysis that support our belief that this is nothing more than a very deep “washout low” price rotation happening right now. The WHITE line on this chart shows the key price lows that are currently at risk in traditional price theory rotation. A breach of that White line by the end of this week would indicate that we could see much further downside price movement – possibly to test the lower Support Zone level. Beyond this analysis, the ultimate price low that is holding us back from calling this a “new bearish trend” is that February 2018 price low near 2529.75. As long as price stays above that level, the overall bullish price trend is still in place.
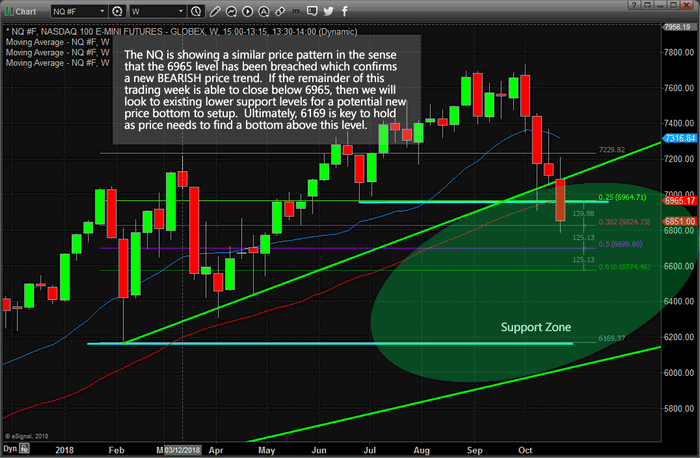
This Weekly NQ chart helps to understand how the deeper NASDAQ price rotation has played out and where the true support and critical price levels are located. The Support Zone in the NQ is much larger than in the ES. This is because the price expansion in the NQ has been much greater than in the ES – thus, the range between current and long-term support is greater. Additionally, we have critical price lows from February 2018 near $6164. Although the recent price moves lower have seemed massive and a crisis like event, we are talking about 10.5% downside correction. To give that some perspective, the correction in March 2018 in the NQ was a total of about -11.5%. The price correction near the end of 2015~2016 in the NQ was about -18%. The price correction near the end of 2012 in the NQ was a total of about -13%. Want to know what happened after all of these various deeper price corrections – the market moved MUCH HIGHER.
Please pay attention to our research and our predictive modeling systems. Skilled traders attempt to find opportunities in any market condition and execute for success no matter what the markets are doing. Keeping a calm and rational head through all of this is critical to being able to achieve success.
If you want to learn about what we do and how we help our members find greater success, please visit www.TheTechnicalTraders.com to learn more. We pride ourselves on being ahead of these market moves and helping our members find and execute trades for greater success. We called this downside market move over 3 weeks before it happened and you can read how we did it by visiting www.TheTechnicalTraders.com/FreeResearch/. Please take a minute to see if our services and tools can help you create greater success in 2019 and beyond.
Chris Vermeulen
www.TheTechnicalTraders.com
Chris Vermeulen has been involved in the markets since 1997 and is the founder of Technical Traders Ltd. He is an internationally recognized technical analyst, trader, and is the author of the book: 7 Steps to Win With Logic
Through years of research, trading and helping individual traders around the world. He learned that many traders have great trading ideas, but they lack one thing, they struggle to execute trades in a systematic way for consistent results. Chris helps educate traders with a three-hour video course that can change your trading results for the better.
His mission is to help his clients boost their trading performance while reducing market exposure and portfolio volatility.
He is a regular speaker on HoweStreet.com, and the FinancialSurvivorNetwork radio shows. Chris was also featured on the cover of AmalgaTrader Magazine, and contributes articles to several leading financial hubs like MarketOracle.co.uk
Disclaimer: Nothing in this report should be construed as a solicitation to buy or sell any securities mentioned. Technical Traders Ltd., its owners and the author of this report are not registered broker-dealers or financial advisors. Before investing in any securities, you should consult with your financial advisor and a registered broker-dealer. Never make an investment based solely on what you read in an online or printed report, including this report, especially if the investment involves a small, thinly-traded company that isn’t well known. Technical Traders Ltd. and the author of this report has been paid by Cardiff Energy Corp. In addition, the author owns shares of Cardiff Energy Corp. and would also benefit from volume and price appreciation of its stock. The information provided here within should not be construed as a financial analysis but rather as an advertisement. The author’s views and opinions regarding the companies featured in reports are his own views and are based on information that he has researched independently and has received, which the author assumes to be reliable. Technical Traders Ltd. and the author of this report do not guarantee the accuracy, completeness, or usefulness of any content of this report, nor its fitness for any particular purpose. Lastly, the author does not guarantee that any of the companies mentioned in the reports will perform as expected, and any comparisons made to other companies may not be valid or come into effect.
Chris Vermeulen Archive |
© 2005-2022 http://www.MarketOracle.co.uk - The Market Oracle is a FREE Daily Financial Markets Analysis & Forecasting online publication.