


The Stock Market’s Volatility is Very High. What’s Next
Stock-Markets / Stock Markets 2018 Oct 28, 2018 - 03:54 PM GMTBy: Troy_Bombardia

What a week for the U.S. stock market. Conventional technical analysis would have you believe that “the world is ending” because trendline support has been broken.
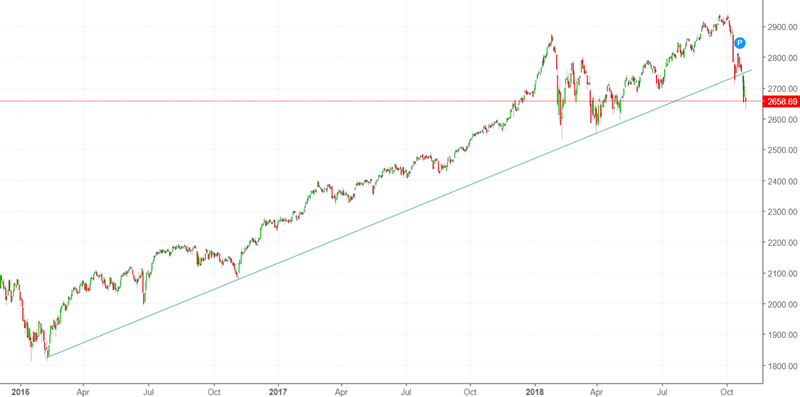
We disagree. Trendlines and support/resistances have too many false breakouts and breakdowns.
*Let’s analyze the stock market’s price action by objectively quantifying technical analysis. For the sake of reference, here’s the random probability of the U.S. stock market going up on any given day, week, or month.

Volatility soared: medium term bullish for stocks
Volatility is mean-reverting.
- When volatility is extremely low, it tends to spike.
- When volatility is extremely high, it tends to fall.
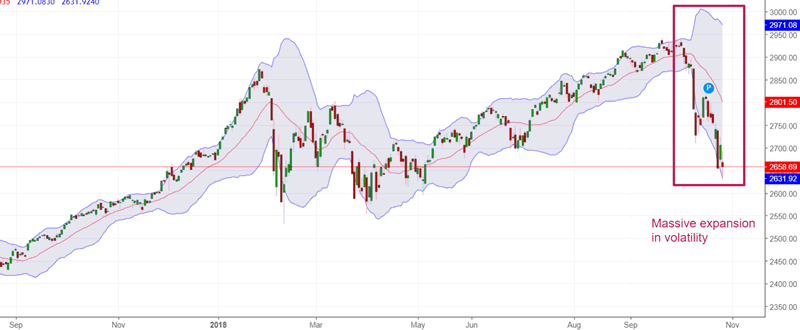
Volatility is extremely high right now. The S&P’s 20 day Bollinger Bands have expanded by more than 5.5x in the past 3 weeks.
Here’s what happens next to the S&P 500 (historically) when its 20 day standard deviation (used in Bollinger Bands) expands by more than 5.5x in 3 weeks.
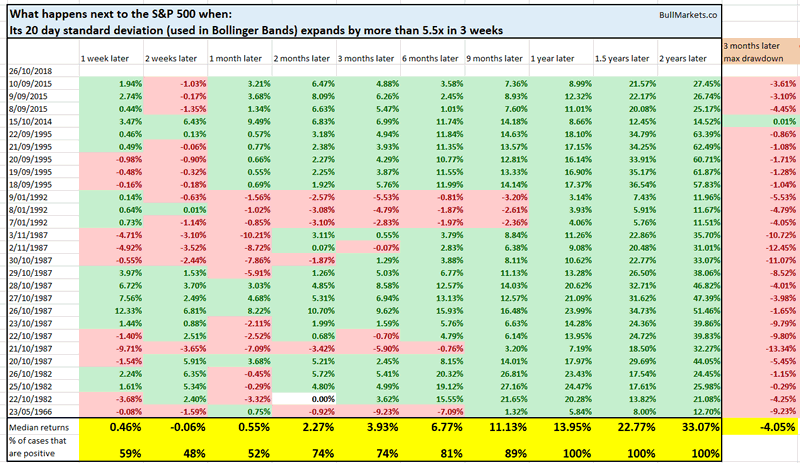
Yes, a lot of these historical cases are overlaps. But more importantly:
- Every single case saw the stock market higher 1 year later.
- Most cases saw the stock market higher 9 months later (the 3 bearish cases saw small losses).
These signals are clustered in 1982, AFTER the 1987 crash, 1992, 1995, 2014, and 2015.
Volatility is mean-reverting, and it moves in the opposite direction of the stock market.
Short term will likely remain choppy
The short term (i.e. next few weeks) will most likely remain volatile. It is neither decisively bullish nor bearish right now.
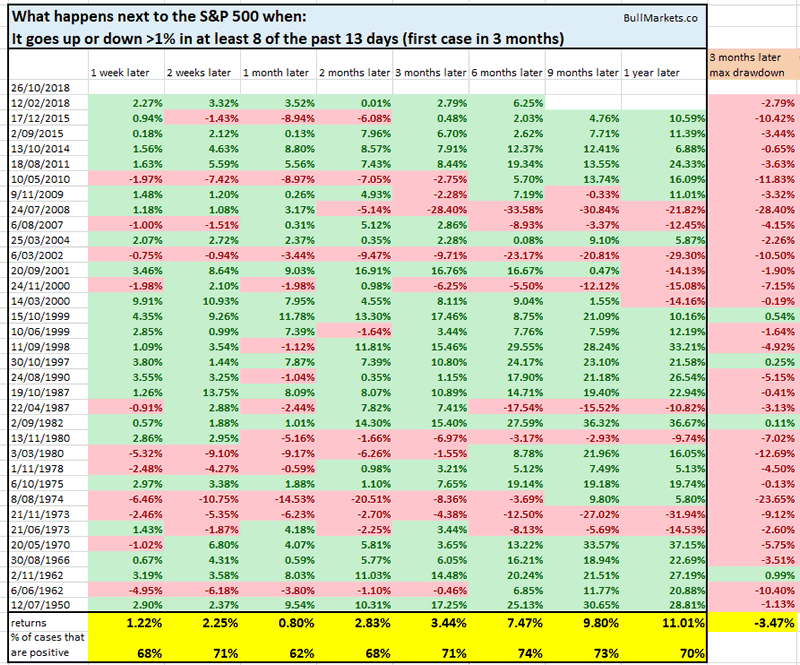
The S&P has gone up or down more than 1% in at least 8 of the past 13 days. Historically, this led to more volatility in forward returns.
Meanwhile, the S&P’s 5 weekly RSI is extremely low. It is now at 13.
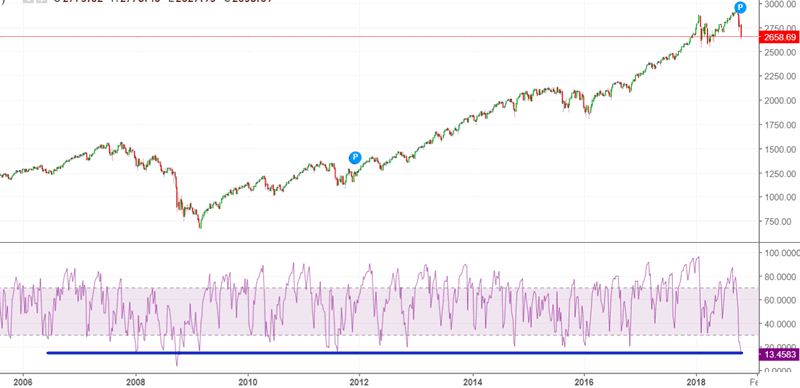
Here’s what happens next to the S&P 500 (historically) when its 5 weekly RSI falls below 14 for the first time in 3 months (i.e. right now).
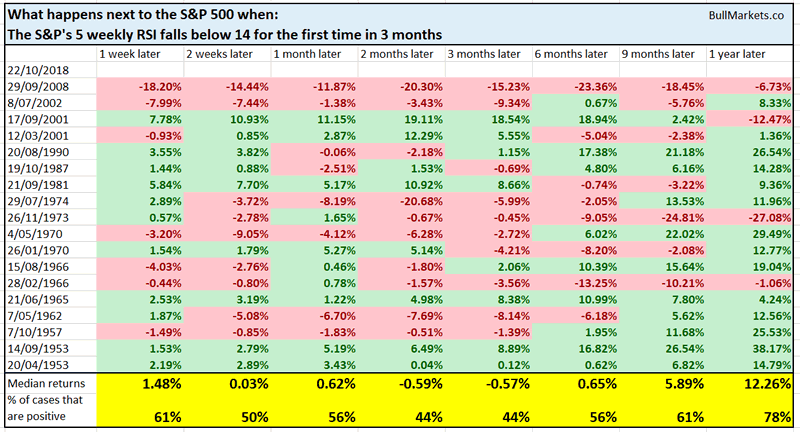
As you can see, the S&P tends to:
- Make a short term bounce over the next few days, then..
- Lower low in the next 2-3 months (i.e. RSI divergence).
I wouldn’t worry about this too much. Looking at the data, it’s clear that a lot of these cases happen AFTER the stock market has already crashed 30%+. With the stock market down -10% right now, the context is clearly different. Context matters.
Regardless, this suggests more short term volatility.
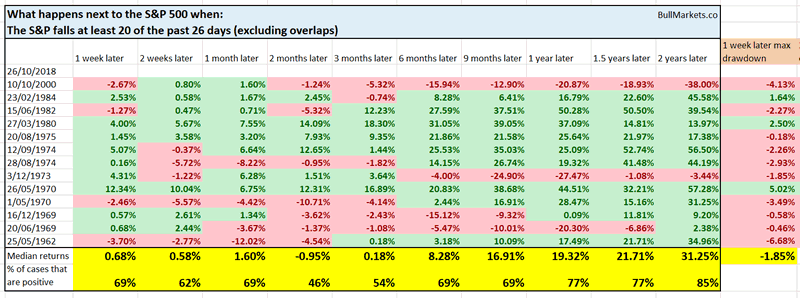
In similar fashion, the S&P has fallen at least 20 of the past 26 days. That’s a lot of “down” days in such a short period of time. Historically, this led to a:
- Bounce over the next week
- Lower low in the next 2 months before bottoming.
And lastly, the S&P is now more than 2.3 standard deviations below its 20 weekly moving average.

On the surface this seems immediately short term bullish for the stock market.
But the data disagrees.
Here’s what happens next to the S&P 500 when it falls more than 2.3 standard deviations below its 20 weekly moving average (i.e. falls below its lower Bollinger Band).
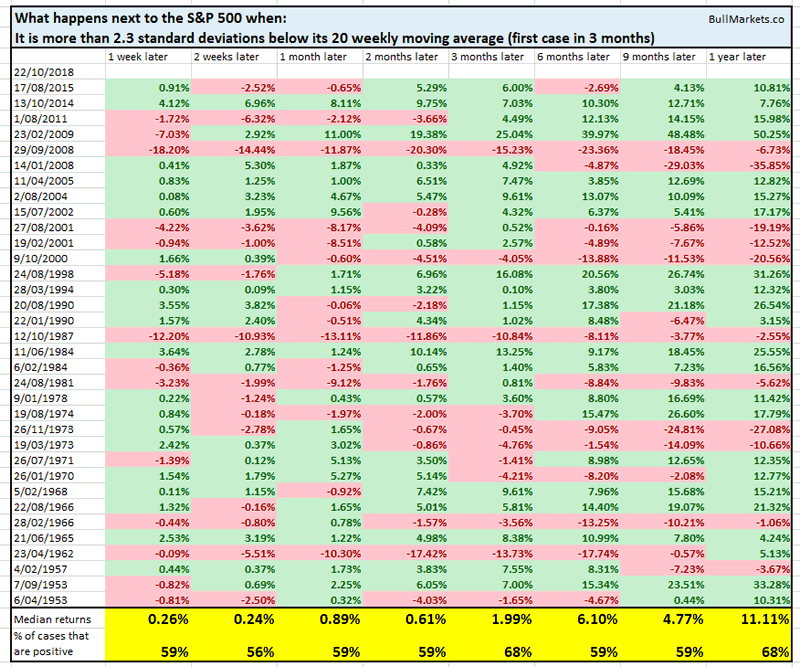 The stock market’s short term forward returns tend to be volatile.
Conclusion
Our discretionary outlook remains the same:
- The current bull market will peak sometime in mid-2019.
- The medium term remains bullish (i.e. trend for the next 6-9 months). Volatility is extremely high right now. Since volatility is mean-reverting and moves in the opposite direction of the stock market, this is decisively medium term bullish.
- The short term is a 50-50 bet right now. Moreover, the stock market will probably remain volatile in the short term (big up and down swings).
- When the stock market’s short term is unclear (as it is most of the time), focus on the medium term. Step back and look at the big picture. Don’t lose yourself in a sea of noise.
Our discretionary outlook is usually, but not always, a reflection of how we’re trading the markets right now. We trade based on our clear, quantitative trading models, such as the Medium-Long Term Model.
Members can see exactly how we’re trading the U.S. stock market right now based on our trading models.
Click here for more market studies
By Troy Bombardia
I’m Troy Bombardia, the author behind BullMarkets.co. I used to run a hedge fund, but closed it due to a major health scare. I am now enjoying life and simply investing/trading my own account. I focus on long term performance and ignore short term performance.
Copyright 2018 © Troy Bombardia - All Rights Reserved
Disclaimer: The above is a matter of opinion provided for general information purposes only and is not intended as investment advice. Information and analysis above are derived from sources and utilising methods believed to be reliable, but we cannot accept responsibility for any losses you may incur as a result of this analysis. Individuals should consult with their personal financial advisors.
© 2005-2022 http://www.MarketOracle.co.uk - The Market Oracle is a FREE Daily Financial Markets Analysis & Forecasting online publication.