XLY – Don’t Count the American Consumer Out Yet
Stock-Markets / Retail Sector Nov 23, 2018 - 07:31 AM GMT The U.S. Consumer Measured Via the XLY
“The U.S. economy is the global economic driver. And within the U.S. economy, the U.S. consumer is the global driver.” James P. Gorman
We’re Entering In Negative Territory for 2018
The stock market (measured via the S&P 500 and Dow Jones Industrial Average) has officially erased all of its 2018 gains. I can see from the headlines like the one pictured below from The Drudge Report that there’s certainly starting to be a bit of panic in the air.

The Parts of the Machine Matter
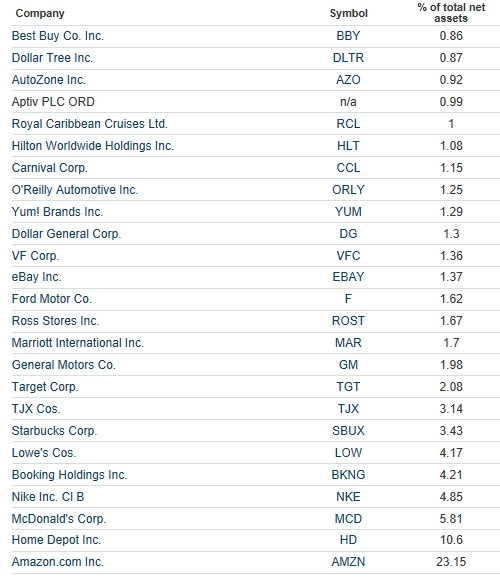
One of the beneficiaries of this year’s market rise was the Consumer Discretionary Sector ETF, XLY as it still remains above its 2018 low near 98 with a price currently near 101. The main reason for XLY’s rise was due to Amazon’s 23.15% weighting in the ETF and the fact that even with the recent downturn in AMZN it is still well above its 2018 low. You can see below that AMZN dwarfs its nearest XLY weighted fellow component, HD (10.6%), by over 2 to 1. Behind HD nothing comes close in terms of comparable influence upon XLY.
What are We Expecting for XLY Going Into the Holiday Shopping Season?
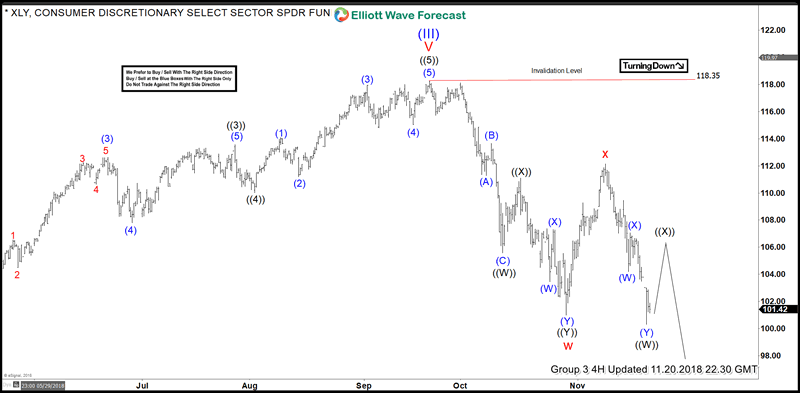
XLY has just now confirmed that the ETF is headed lower along side AMZN. You can see in the chart below that the most recent proposed wave count suggest that this bearish price action is merely a correction. The larger trend is indeed bullish. But, in the meantime, there exists the similarity with AMZN that traders can expect more tradable downside in the near term.
The Wave Count for XLY
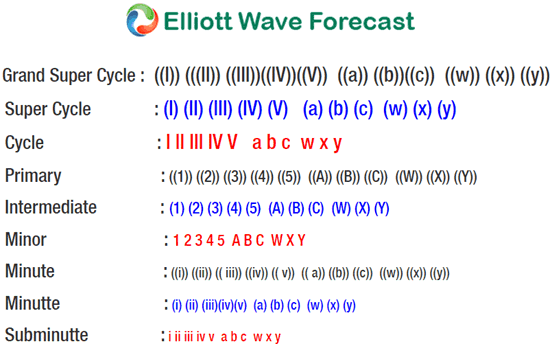
The cycle from XLY’s 2009 low (15.72) remains in progress as an impulse structure, where Super Cycle degree wave (I) ended in 5 waves at 80.61 while Super Cycle degree wave (II) ended as a Flat at 67.07 on 2/11/2016 low.
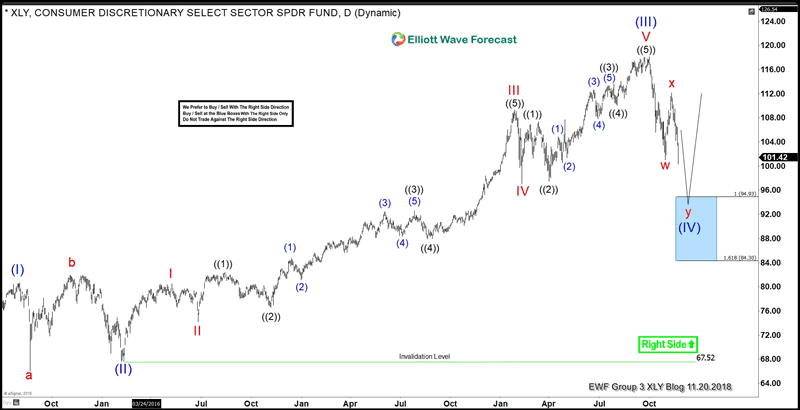
Currently, it has ended the cycle from the 2/11/2016 low in Super Cycle degree wave (III) at the 118.26 high. Coming down from there XLY is remains correcting the aforementioned cycle in a Super Cycle degree wave (IV) pullback as a double three structure consisting of Cycle degree waves w – x – y. In the near term while the 112.15 Cycle degree x wave high of 11/08/2018 holds expect lower prices to target the extreme equal leg and extension area of 95-84.
If you’re curious to learn our methodology there’s no better time than now with our Black Friday Offer or our 14 Day Free Trial Offer. We look forward to seeing you around!
James
EWF Analytical Team
https://elliottwave-forecast.com
ElliottWave-Forecast has built its reputation on accurate technical analysis and a winning attitude. By successfully incorporating the Elliott Wave Theory with Market Correlation, Cycles, Proprietary Pivot System, we provide precise forecasts with up-to-date analysis for 52 instruments including Forex majors & crosses, Commodities and a number of Equity Indices from around the World. Our clients also have immediate access to our proprietary Actionable Trade Setups, Market Overview, 1 Hour, 4 Hour, Daily & Weekly Wave Counts. Weekend Webinar, Live Screen Sharing Sessions, Daily Technical Videos, Elliott Wave Setup .
Copyright © 2018 ElliottWave-Forecast - All Rights Reserved Disclaimer: The above is a matter of opinion provided for general information purposes only and is not intended as investment advice. Information and analysis above are derived from sources and utilising methods believed to be reliable, but we cannot accept responsibility for any losses you may incur as a result of this analysis. Individuals should consult with their personal financial advisors.
© 2005-2022 http://www.MarketOracle.co.uk - The Market Oracle is a FREE Daily Financial Markets Analysis & Forecasting online publication.


