


Natural Gas Breaks Lower Towards Our $3.00 Target
Commodities / Natural Gas Dec 11, 2018 - 03:20 PM GMTBy: Chris_Vermeulen

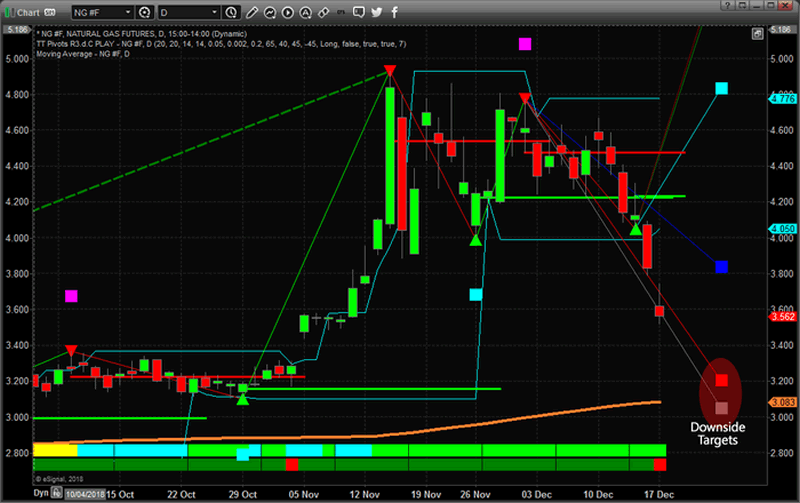
Just about seven days ago we alerted all of our followers to a massive breakdown move that was about to unfold in Natural Gas. At that time, we predicted the price of Natural Gas would break below $4.30 and fall quickly towards the $3.00~3.20 level. Taking a look at that call now, with the price below $3.60, it seems our analysis was perfectly timed.
This Daily Natural Gas chart highlighting our predictive Fibonacci price modeling system shows the downside price targets that are waiting to confirm price support and a potential “deep V bottom formation”. If you recall from our earlier research, we believe this downside move will end rather quickly with a deep V type of price bottom setting up near the end of 2018. This means we expect the price of Natural Gas to begin to rally into 2019 after reaching the $3.00~3.20 level soon.
This is an incredible move for skilled traders. We are watching a $2.50 price move in Natural Gas unfold right before our eyes – and it appears this rotation will complete before the end of February 2019. -$1.40 to the downside, then +1.20 to the upside. Just follow the predictive modeling systems and ride it out.
We’ll alert you when the bottom sets up and when the upside move it about to unfold, but for now, we are watching for NG to move into the support zone (near $3.20). Once that level is reached, a technical price bottom should start to set up and the new rally back towards $4.00 will likely start in early January 2019.
Want to learn how our advanced price modeling tools can make calls like this weeks and months in advance? Visit www.TheTechnicalTraders.com to learn about our research, services, daily videos, and more solutions to help skilled traders stay ahead of these market moves. Our advanced predictive modeling solutions and years of market research provide our members with a clear advantage you won’t find anywhere else. Consider joining our services as a Christmas Gift to yourself!
Chris Vermeulen
www.TheTechnicalTraders.com
Chris Vermeulen has been involved in the markets since 1997 and is the founder of Technical Traders Ltd. He is an internationally recognized technical analyst, trader, and is the author of the book: 7 Steps to Win With Logic
Through years of research, trading and helping individual traders around the world. He learned that many traders have great trading ideas, but they lack one thing, they struggle to execute trades in a systematic way for consistent results. Chris helps educate traders with a three-hour video course that can change your trading results for the better.
His mission is to help his clients boost their trading performance while reducing market exposure and portfolio volatility.
He is a regular speaker on HoweStreet.com, and the FinancialSurvivorNetwork radio shows. Chris was also featured on the cover of AmalgaTrader Magazine, and contributes articles to several leading financial hubs like MarketOracle.co.uk
Disclaimer: Nothing in this report should be construed as a solicitation to buy or sell any securities mentioned. Technical Traders Ltd., its owners and the author of this report are not registered broker-dealers or financial advisors. Before investing in any securities, you should consult with your financial advisor and a registered broker-dealer. Never make an investment based solely on what you read in an online or printed report, including this report, especially if the investment involves a small, thinly-traded company that isn’t well known. Technical Traders Ltd. and the author of this report has been paid by Cardiff Energy Corp. In addition, the author owns shares of Cardiff Energy Corp. and would also benefit from volume and price appreciation of its stock. The information provided here within should not be construed as a financial analysis but rather as an advertisement. The author’s views and opinions regarding the companies featured in reports are his own views and are based on information that he has researched independently and has received, which the author assumes to be reliable. Technical Traders Ltd. and the author of this report do not guarantee the accuracy, completeness, or usefulness of any content of this report, nor its fitness for any particular purpose. Lastly, the author does not guarantee that any of the companies mentioned in the reports will perform as expected, and any comparisons made to other companies may not be valid or come into effect.
Chris Vermeulen Archive |
© 2005-2022 http://www.MarketOracle.co.uk - The Market Oracle is a FREE Daily Financial Markets Analysis & Forecasting online publication.