


Stock Market Prediction – PART I
Stock-Markets / Stock Markets 2018 Feb 09, 2019 - 03:11 PM GMTBy: Chris_Vermeulen

As we enter the final stage of our market predictions from nearly 5 months ago, we thought it would be a good time to revisit these predictions and to update all of our followers with some timely and, apparently, accurate market data. We hope that many of you remember out predictions from September 2018 where we called for a 5~8% market decline, followed by a basing market headed into the November 2018 US elections, followed by a deep “Ultimate Low” price rotation before we called for an incredible upside price rally? The reason it is so important to watch for and understand all of our research is that we are attempting to provide great value and insight to our followers as well as help them protect their open positions from unknown risks.
As a bonus to all of this, we are going to include predictions made by our Adaptive Dynamic Learning (ADL) price modeling system that originated from December 2017 going all the way forward through to the end of May 2019. Can you imagine what it would be like to have a tool that could show you what is likely to happen going forward 6 months, 12 months or even 24 months into the future? Well, that is what we have with the ADL predictive price modeling system and we are going to show you how well it has been able to pick the future of the markets for the past 15+ months. Here we go.
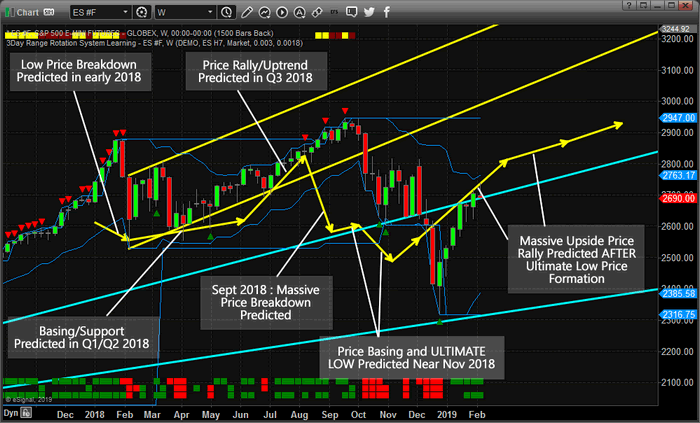
At this point, we are going to highlight our earlier predictions (all of 2018 and into Q1/Q2 of 2019) and show you what the market has done since these calls were made back in September 2018. Pay attention to this Weekly ES (S&P 500 chart) and pay attention to the YELLOW ARROWS on this chart. We have highlighted key predictive price modeling points with these yellow arrows on the chart to show you what our ADL predictive modeling system suggested would happen back in December 2017.
If you follow these arrows from left to right, you’ll see how the ADL system predicted an early price breakdown in 2018 – we call this a “Price Anomaly” where price moves against the predicted price targets, then reverts back to near these targets. These can be incredibly profitable trading opportunities for skilled traders as well. That early 2018 breakdown in price was a -318 pt move (-10.95%) and we were alerted to it well before it happened.
The next phase of the ADL price modeling system was to suggest that Q1 and Q2 2018 would settle into an extended basing pattern with a moderate upside price bias. You can see how accurate the timing of this ADL prediction was and how price reacted to this basing phase through June 2018.
The next phase of the ADL price model showed a Q3 price rally/uptrend with a potential upside move of about +210 pts (+8%). The real price move from these points (basing end to top) was +197 pts (+7.19%). The actual price top (another Price Anomaly pattern) happened on September 17/24, 2018.
Pay attention to that last date: September 17, 2018, and read this post from that date. This is the research post that issued our latest warning/predictions that cover the past 5+ months.
You can clearly see that our ADL predictive modeling system was calling for a -5~8% price decline in August, September 2018. Again, this type of early warning feature provided by the ADL also sets up Price Anomaly patterns – when price moves against the ADL predictive modeling system and allows for a reversion trade setup. This is just such an event. As we were aware of the potential for a downside price event, yet price continued to push higher till October 1, 2018. When price did, finally, break lower, we can see how quickly the -5~8% ADL prediction became true. It only took 6 weeks for the price to break downward -326 pts (-11.15%), then begin to base.
This is where things start to get interesting for us and our readers/followers. Our analysis on September 17, 2018, suggested that the US stock markets would base and trade sideways before the November 6, 2018, US elections, then break lower to establish an “Ultimate Low” price pattern. What we didn’t expect was the size and scope of the “Ultimate Low” price rotation that happened in the markets. Our ADL modeling system suggested a -115 pt (-4.45%) downward price rotation was likely. What really happened was the markets collapsed -453 pts (-16.17%).
After the Ultimate Low price setup, the ADL predicted an upside price rally in excess of 400 pts (+17.5%) and what has recently transpired, so far, is an upside price rally of 421 pts (+18.17%).
Think about how powerful this predictive price modeling system really is to be able to call this market moves 10~20+ months in advance. Certainly, it is not perfect in every prediction, but the advanced knowledge and resources it provides is has proven to be a powerful tool for insight into future price direction.
What should we expect going forward? Take a look at the yellow lines drawn into the future of this chart. If our ADL price model is correct, then we should continue to see more moderate upside price bias with prices trading a bit more narrowly in a “melt-up” type of environment through the middle/end of June 2018. Want to know what our ADL predictive price model is showing for the rest of the year and into early 2020, then visit www.TheTechnicalTraders.com and learn why our members benefit from our tools and research in far more detail than we deliver in these public posts.
It is not too often that we share this level of research with the general public. We issued the September 2018 research post because we wanted to warn our followers that a massive price decline/rotation was about to unfold. You can read all of our public free research posts. Today, we are sharing with you our ADL predictive price modeling results for the next 3~4 months for the SP500 – how valuable is that? If you save or print this article, you will be able to reference it going forward for the next 90+ days and compare the real price action to our ADL predictive modeling results. We believe the results will be similar to what our ADL is suggesting and we can see these ADL results for any instrument traded throughout the world.
We believe 2019 will be an incredible year for skilled traders and we believe the markets will set up numerous trade setups for fantastic profits. We are already hard at work developing new member tools, research models and algo trading systems to help our members take advantage of these incredible market moves. Please take a minute to see how our researchers and traders at www.TheTechnicalTraders.com can assist you this year. We will be launching an incredible new member tool in about 30~60 days. You won’t want to miss this fantastic new software utility to help you find and execute great trades. See you in the member’s section of our site.
Chris Vermeulen
www.TheTechnicalTraders.com
Chris Vermeulen has been involved in the markets since 1997 and is the founder of Technical Traders Ltd. He is an internationally recognized technical analyst, trader, and is the author of the book: 7 Steps to Win With Logic
Through years of research, trading and helping individual traders around the world. He learned that many traders have great trading ideas, but they lack one thing, they struggle to execute trades in a systematic way for consistent results. Chris helps educate traders with a three-hour video course that can change your trading results for the better.
His mission is to help his clients boost their trading performance while reducing market exposure and portfolio volatility.
He is a regular speaker on HoweStreet.com, and the FinancialSurvivorNetwork radio shows. Chris was also featured on the cover of AmalgaTrader Magazine, and contributes articles to several leading financial hubs like MarketOracle.co.uk
Disclaimer: Nothing in this report should be construed as a solicitation to buy or sell any securities mentioned. Technical Traders Ltd., its owners and the author of this report are not registered broker-dealers or financial advisors. Before investing in any securities, you should consult with your financial advisor and a registered broker-dealer. Never make an investment based solely on what you read in an online or printed report, including this report, especially if the investment involves a small, thinly-traded company that isn’t well known. Technical Traders Ltd. and the author of this report has been paid by Cardiff Energy Corp. In addition, the author owns shares of Cardiff Energy Corp. and would also benefit from volume and price appreciation of its stock. The information provided here within should not be construed as a financial analysis but rather as an advertisement. The author’s views and opinions regarding the companies featured in reports are his own views and are based on information that he has researched independently and has received, which the author assumes to be reliable. Technical Traders Ltd. and the author of this report do not guarantee the accuracy, completeness, or usefulness of any content of this report, nor its fitness for any particular purpose. Lastly, the author does not guarantee that any of the companies mentioned in the reports will perform as expected, and any comparisons made to other companies may not be valid or come into effect.
Chris Vermeulen Archive |
© 2005-2022 http://www.MarketOracle.co.uk - The Market Oracle is a FREE Daily Financial Markets Analysis & Forecasting online publication.