BlackRock Breaking Higher after Earning Release, Whats next?
Companies / Company Chart Analysis Apr 18, 2019 - 10:46 AM GMTIn today’s blog, we will have a look at the latest price action of the Blackrock stock. The stock is listed in the S&P500.
BlackRock is an American company which is based in York City. It is a global investment management company for institutional clients and also for retail investors. Current chairman and CEO of BlackRock is Laurence Douglas Fink mostly called Larry Fink.
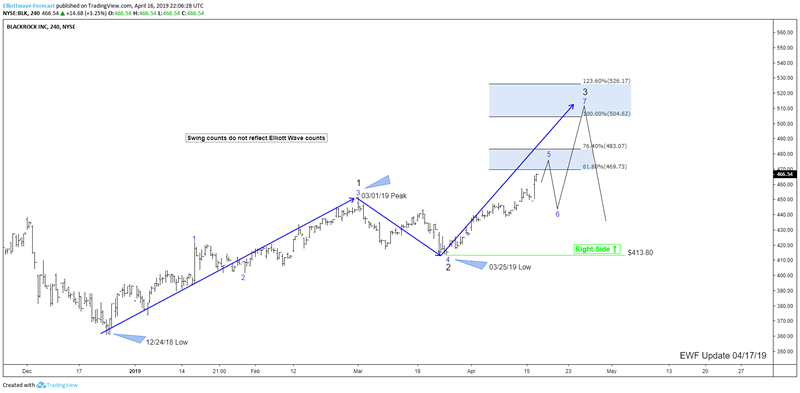
BlackRock is the world largest asset manager with over $6 trillion assets under its current management. Which makes it one of the biggest and most powerful investment management company in the world. The company released yesterday its first-quarter earnings. The revenue came out at $3.35 billion, which was slightly higher than the expectations of $3.33 billion. Adjusted earnings per share: $6.61, beating expectations of $6.12. Which made the stock breaking its 03/01/19 peak, making the right side higher against $412.80 low which can be seen in the chart below.
BlackRock 04.17.2019 4H Sequence Analysis

Due to the earnings release, the stock managed to break above 03/01/19 peak opening up further extension higher. Making it now a 5 swing incomplete bullish sequence from 12/24/18 low. Ideally, BlackRock should see $467.73-483.07 areas which is the 0.618-0.764 extension area from its 12/24/18 lows. in that area, it is expected to end the 5th swing followed by a pullback in swing 6. Before another extension higher into the initial equal legs should be seen.
The target area of the equal legs extreme comes at around $504.62-$526.17 were a bigger reaction lower is expected to take place and also to end the 7th swing. For now, any pullback against 03/25/19 low should find buyers the sequences of 3-7 or 11 swings, targeting the equal legs area ($504.62-$526.17).
I hope you liked this blog and I wish you all good trades. And for all who are interested in learning more about our unique blue box areas and also want to trade profitably in 2019 then sign up for a free 14 days trial you can cancel anytime. Click the link and see you insight
By EWFSanjay
https://elliottwave-forecast.com
ElliottWave-Forecast has built its reputation on accurate technical analysis and a winning attitude. By successfully incorporating the Elliott Wave Theory with Market Correlation, Cycles, Proprietary Pivot System, we provide precise forecasts with up-to-date analysis for 52 instruments including Forex majors & crosses, Commodities and a number of Equity Indices from around the World. Our clients also have immediate access to our proprietary Actionable Trade Setups, Market Overview, 1 Hour, 4 Hour, Daily & Weekly Wave Counts. Weekend Webinar, Live Screen Sharing Sessions, Daily Technical Videos, Elliott Wave Setup .
Copyright © 2019 ElliottWave-Forecast - All Rights Reserved Disclaimer: The above is a matter of opinion provided for general information purposes only and is not intended as investment advice. Information and analysis above are derived from sources and utilising methods believed to be reliable, but we cannot accept responsibility for any losses you may incur as a result of this analysis. Individuals should consult with their personal financial advisors.
© 2005-2022 http://www.MarketOracle.co.uk - The Market Oracle is a FREE Daily Financial Markets Analysis & Forecasting online publication.


