


Could Silver Break-out like it did in 2011?
Commodities / Gold & Silver 2020 Feb 09, 2020 - 05:10 PM GMTBy: Richard_Mills

Silver is expected to begin the 2020s newly burnished, through a combination of higher industrial and investment demand, and tightened supply owing to mine production issues and output cuts. If it does, it would be the continuation of a trend that started last year.
2019 was an excellent year for gold and silver. Both metals began to run last summer after the US Federal Reserve started cutting interest rates. In July the Fed lowered rates three times before freezing the (benchmark) federal funds rate at a range of 1.5 - 1.75% in November. The market is reportedly expecting multiple cuts in 2020.
That, along with similarly dovish policies among other central banks, a record $17-trillion of negative-yielding sovereign bonds, and fresh safe haven demand due to tensions with Iran, and a lack of progress on trade talks, to name two key issues, powered precious metals to new heights.
Spot gold and silver both peaked in early September at a respective $1,552.00/oz and $19.67/oz. Taking a long-term view of silver and gold prices reveals that the precious metals move in almost identical patterns. Over the last year gold and silver have each gained about 25% (trough to peak); over the last five years gold gained 45% to silver’s 40%.
Charting the metals back to 2010, the correlation is tight. When gold goes up, it almost always takes silver with it.
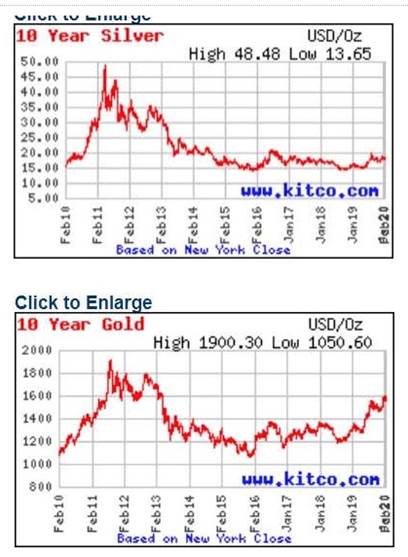
It’s actually fascinating to examine these charts closely. At face value the red lines appear to show a very similar pattern. The spike in both gold and silver happened in 2011, when gold shot up to a record $1,900 an ounce and silver approached $50/oz. But in fact, silver’s streak occurred in April, five months before gold’s big run. This contradicts the prevailing wisdom that silver prices follow gold prices.
The fun for precious metals investors was short-lived; by the end of 2011 silver had dropped to below 2010 levels, and gold fell to under $1,600. In 2012, as the Federal Reserve implemented its third round of quantitative easing, both metals rebounded - gold took off above $1,900 and silver pushed back up to near $50.
Then the crash of 2013, when gold prices plunged a gravity-inducing $200 an ounce over two days, and silver fell even more on a percentage basis, sinking below $25 for the first time since 2010.
Silver and gold trade fairly closely for the next six years but diverge towards the end of the chart; notice the column between Jan ‘19 and Feb ‘20. At the start of 2019 gold turns sharply upward, for a whole year, even touching $1,600 very recently. Silver’s move is much more modest; it only climbs one square on the chart to gold’s three squares - representing $15 to $20 an ounce versus gold’s $1,300 to $1,600.
What happened to cause this anomaly in 2019? We’re not sure but we do know that a reliable way to evaluate gold and silver prices is to look at the gold-silver ratio.
The gold-silver ratio is simply the amount of silver one can buy with an ounce of gold. To find the ratio, divide the current gold price by the price of silver.
On June 12, the gold-silver ratio hit a 26-year high by breaking through the 90-ounce mark - meaning it took over 90 ounces of silver to purchase one ounce of gold. The higher the number, the more undervalued is silver or, to put it another way, the farther gold prices are pulling away from silver prices.
The gold-silver ratio tells precious metals investors, which is under-valued (or over-valued), silver or gold? At the current ratio of 88:1, a trader who has an ounce of gold could sell his gold for 88 ounces of silver, compared to the historical average of 56 silver ounces to one gold ounce. Historically, then, silver is right now extremely under-priced compared to gold.
Incidentally, the 2019 gold-silver ratio of 86:1 ranks among the highest 2% of all time, dating back to 1687! There have been only two years since the US government removed the dollar from the gold peg - 1991 and 1992 - that there were higher ratios.
If silver is so under-valued, we got to thinking, what would it take for silver prices to rise to the levels of nearly a decade ago? What were the silver market conditions in 2011 that could reveal clues as to where silver is going in 2020? This article attempts to answer these questions.
2011 boom and bust
There are numerous suppositions as to why silver climbed 175% in one year before suddenly falling “off a cliff”. (silver plummeted over 25% in two days).
Many observers looked to investment banks like JP Morgan, suspected of manipulating the silver market, which at the time was known to be shorting silver even though prices kept rising. Conspiracy theorists recalled what happened to Warren Buffet’s ill-fated silver squeeze in the 1990s that propelled the price up 80% before crashing.
Dovish monetary policy at the US Federal Reserve was another reason to be bullish on precious metals in early 2011. Three years after the Great Recession, the US economy was still reeling from the mortgage crisis and collapse of Lehman Brothers. Confidence in the US economy was at a record low. The eurozone was in trouble, with Greece, Ireland, Portugal, Italy and Spain all reporting financial problems.
The Fed announced a third round of quantitative easing and reaffirmed it would hold interest rates at zero for at least two years. In August 2011 the Swiss National Bank stunned financial markets by promising to print the Swiss franc in “unlimited quantities” as necessary, to maintain a peg between the franc and the euro - resulting in a flood of investments out of the franc and into other safe-haven currencies or precious metals.
Elsewhere in Europe, central banks remained committed to resolving the debt crisis by even more borrowing.
The result of all of these economic factors, including a belief that the dollar was under siege, was for investors to seek safe-haven assets like gold and silver.
A more intricate reasoning for silver’s rise involved the use of silver in solar panels. This theory begins with the belief that industrial demand for silver was surging in 2011, due in part to the photovoltaic industry consuming silver in much higher quantities than previously. Supply wasn’t able to keep up, leaving a shortfall. This, it turns out, wasn’t quite true. While the industry did experience massive growth between 2008 and 2011 - silver demand rose 338%! - it barely registered as a demand driver, according to BullionVault.
The silver market was also thought to be tight due to a shortage of high-purity bars required for the silver paste that goes into solar panels. These 0.9999 fine silver bars are less common than the regular 0.999 bars, so when the supply of high-purity bars ran low, corresponding with the hike in the silver price, a cause and effect was assumed. There was in fact a shortage of 0.9999 bars, but the supply of raw-material (mined) silver remained well stocked. Between 2003 and 2012 the silver market was in a significant surplus six times, BullionVault notes.
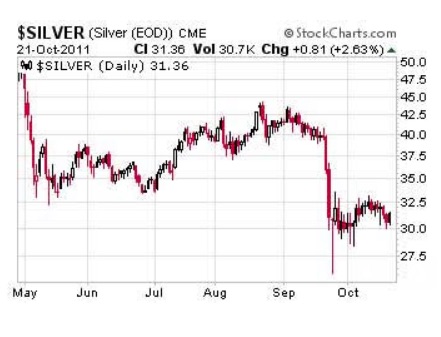
Whatever the reason, or reasons, for its jump, silver’s surprising journey to $49 stopped abruptly in mid-September, 2011. Initiated by then-Fed Chairman Ben Bernanke’s decision not to proceed with more quantitative easing, Money Metals Exchange explains what happened next:
Disappointed “long” traders began selling their contracts. As prices fell, the margin calls began – forcing weak hands to sell. Then major U.S. and Asian exchanges increased margin requirements. The result of these rapid-fire events was a near-term rout in the paper prices for gold and silver.
The precious metal plunged from a peak of $49 an ounce to under $40 within a week - silver’s biggest three-day plunge in 28 years.
Silver investors and traders know the metal to be thinly traded and therefore volatile, but the scope of the correction raised eyebrows.
Some traders blamed the unwinding of the long-silver, short-dollar hedge for the scale of the correction. The Telegraph quotes the president of the precious metals trading firm Dillon Gage, saying “US investors bought silver and gold as a way to hedge against further erosion in the dollar's buying power.”
Conspiracy theorists appeared to be validated when a rumor circulated about massive selling out of George Soros’s hedge fund. In the following weeks a lawsuit was filed against JP Morgan and HSBC, alleging market manipulation. However both the CFTC and a New York appeals court found no indications of collusion or criminal abuse of the silver market.
Gold-silver ratio as indicator
Wouldn’t it be great if we had a tried and true forecasting tool that could tell us when silver (and gold) prices are going to take off? Of course possessing such a thing would stand to make us A LOT of money! Sadly, we don’t.
What we do have is the gold-silver ratio, and the knowledge that the precious metals usually move in the same direction - although silver historically leaps faster and higher than gold.
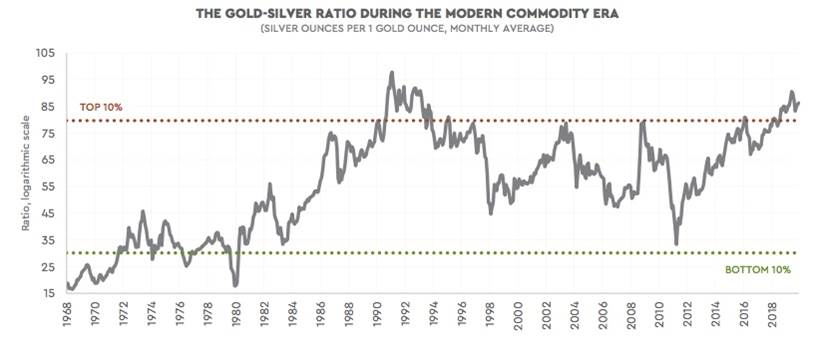
As mentioned at the top, the current gold-silver ratio of 88:1 is near historic highs. For the ratio to drop, either gold needs to fall or silver to rise. The question silver investors want answered is, when are rising silver prices going to bring the ratio down to a more reasonable level, that reflects the bullish fundamentals for silver?
We get some help here from a May 2019 column in Kitco, authored by renowned mining investor and commentator Lobo Tiggre. He notices that since 2011, instead of trailing along with gold, silver keeps getting cheaper and cheaper relative to gold. So what gives?
We don’t know the answer to why silver investors aren’t acting on the flashing-red neon “Buy now!” sign indicated by the high gold-silver ratio. But according to Jason Hamlin, a commodities analyst writing in Seeking Alpha, the ratio is one of the most reliable “buy” indicators for silver whenever it is above 80. (ie., now)
Silver Mines Ltd. Managing Director Anthony McLure confirms this, reportedly telling the Denver Gold Forum last September that the higher-than-normal ratio is often the “precursor to a [silver] bull run.”
Peter Schiff, in a recent column, states that because silver is, despite its many industrial uses, still a monetary metal, it tends to track relatively consistently with gold over time. When gold goes up [as it is doing now], it almost always takes silver with it.
Furthermore, it may well mean the silver-gold ratio will shrink again as it did in the years after the ’08 crash. Historically, during a bull market in gold, silver outperforms. If this holds trues, that ratio will close.
Conclusion
The silver market today is obviously quite different from the one in 2011 that saw silver jump to an all-time high of $49 an ounce. Could it run that far again? We believe so.
Consider: industrial demand for silver, particularly photovoltaics, is heading up, and should get another lift if and when the trade war with China is put to rest. Investment demand for silver also looks solid, with no end in sight to the low-interest-rate policy direction of central banks.
Add higher demand to shrinking supply, lower grades, and less silver by-product credits from falling lead and zinc mine production, we see a floor forming under silver prices.
The 88:1 gold-silver ratio is very high by historical standards. This is a warning to investors that at any time, the ratio could correct, either meaning a move up in silver prices or a move down in gold prices. Gold is holding up very well despite a Phase 1 trade deal with China, a continued strong dollar and higher sovereign bond yields in the US than elsewhere. At AOTH we do not believe the gold price is going to fall, quite the opposite.
Peter Schiff, states, Silver has hit an all-time high of $49 per ounce twice – in January 1980 and then again in April 2011. If you adjust that $49 high for inflation, you’re looking at a price of around $150 per ounce. In other words, silver has a long way to run up. As one analyst put it, “With the long-term downside potential of silver very low versus its current valuation, the risk/reward is one of the best investments on the planet.”
We don’t know what will be the catalyst that makes silver leap again, like it did in 2011, or when it will happen, but one thing is for sure: when silver runs, volatility will be high. It will likely spike fast, without warning, and probably, percentage wise, much higher than gold.
By Richard (Rick) Mills
If you're interested in learning more about the junior resource and bio-med sectors please come and visit us at www.aheadoftheherd.com
Site membership is free. No credit card or personal information is asked for.
Richard is host of Aheadoftheherd.com and invests in the junior resource sector.
His articles have been published on over 400 websites, including: Wall Street Journal, Market Oracle, USAToday, National Post, Stockhouse, Lewrockwell, Pinnacledigest, Uranium Miner, Beforeitsnews, SeekingAlpha, MontrealGazette, Casey Research, 24hgold, Vancouver Sun, CBSnews, SilverBearCafe, Infomine, Huffington Post, Mineweb, 321Gold, Kitco, Gold-Eagle, The Gold/Energy Reports, Calgary Herald, Resource Investor, Mining.com, Forbes, FNArena, Uraniumseek, Financial Sense, Goldseek, Dallasnews, Vantagewire, Resourceclips and the Association of Mining Analysts.
Copyright © 2020 Richard (Rick) Mills - All Rights Reserved
Legal Notice / Disclaimer: This document is not and should not be construed as an offer to sell or the solicitation of an offer to purchase or subscribe for any investment. Richard Mills has based this document on information obtained from sources he believes to be reliable but which has not been independently verified; Richard Mills makes no guarantee, representation or warranty and accepts no responsibility or liability as to its accuracy or completeness. Expressions of opinion are those of Richard Mills only and are subject to change without notice. Richard Mills assumes no warranty, liability or guarantee for the current relevance, correctness or completeness of any information provided within this Report and will not be held liable for the consequence of reliance upon any opinion or statement contained herein or any omission. Furthermore, I, Richard Mills, assume no liability for any direct or indirect loss or damage or, in particular, for lost profit, which you may incur as a result of the use and existence of the information provided within this Report.
© 2005-2022 http://www.MarketOracle.co.uk - The Market Oracle is a FREE Daily Financial Markets Analysis & Forecasting online publication.